Exhibit 99.1
|
|
Company Overview June 2014 |
Exhibit 99.1
|
|
Company Overview June 2014 |
|
|
FORWARD-LOOKING STATEMENTS This presentation contains forward-looking statements within the meaning of Section 27A of the Securities Act of 1933 and Section 21E of the Securities Exchange Act of 1934. All statements, other than statements of historical facts, included in this presentation that address activities, events or developments that Antero Resources Corporation and its subsidiaries (collectively, the “Company” or “Antero”) expects, believes or anticipates will or may occur in the future are forward-looking statements. The words “believe,” “expect,” “anticipate,” “plan,” “intend,” “estimate,” “project,” “foresee,” “should,” “would,” “could,” or other similar expressions are intended to identify forward-looking statements. However, the absence of these words does not mean that the statements are not forward-looking. Without limiting the generality of the foregoing, forward-looking statements contained in this presentation specifically include estimates of the Company’s reserves, expectations of plans, strategies, objectives and anticipated financial and operating results of the Company, including as to the Company’s drilling program, production, hedging activities, capital expenditure levels and other guidance included in this presentation. These statements are based on certain assumptions made by the Company based on management’s experience and perception of historical trends, current conditions, anticipated future developments and other factors believed to be appropriate. Such statements are subject to a number of assumptions, risks and uncertainties, many of which are beyond the control of the Company, which may cause actual results to differ materially from those implied or expressed by the forward-looking statements. These include the factors discussed or referenced under the heading “Item 1A. Risk Factors” in our Annual Report on Form 10-K for the year ended December 31, 2013 and in the Company’s subsequent filings with the SEC. The Company cautions you that these forward-looking statements are subject to all of the risks and uncertainties, most of which are difficult to predict and many of which are beyond our control, incident to the exploration for and development, production, gathering and sale of natural gas and oil. These risks include, but are not limited to, commodity price volatility, inflation, lack of availability of drilling and production equipment and services, environmental risks, drilling and other operating risks, regulatory changes, the uncertainty inherent in estimating natural gas and oil reserves and in projecting future rates of production, cash flow and access to capital, the timing of development expenditures, and the other risks described under the heading “Risk Factors” in our Annual Report on Form 10-K for the year ended December 31, 2013 and in the Company’s subsequent filings with the SEC. Any forward-looking statement speaks only as of the date on which such statement is made and the Company undertakes no obligation to correct or update any forward-looking statement, whether as a result of new information, future events or otherwise, except as required by applicable law. 1 |
|
|
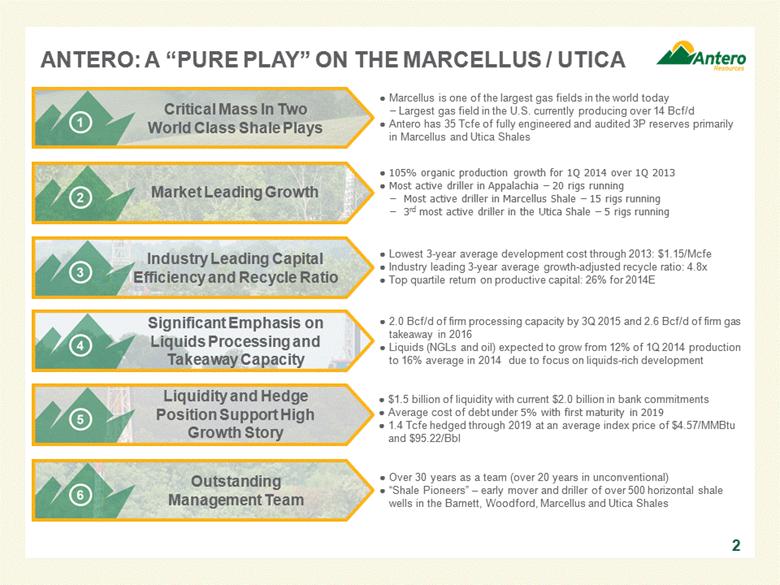
ANTERO: A “PURE PLAY” ON THE MARCELLUS / UTICA Marcellus is one of the largest gas fields in the world today Largest gas field in the U.S. currently producing over 14 Bcf/d Antero has 35 Tcfe of fully engineered and audited 3P reserves primarily in Marcellus and Utica Shales Critical Mass In Two World Class Shale Plays 105% organic production growth for 1Q 2014 over 1Q 2013 Most active driller in Appalachia – 20 rigs running Most active driller in Marcellus Shale – 15 rigs running 3rd most active driller in the Utica Shale – 5 rigs running Market Leading Growth Lowest 3-year average development cost through 2013: $1.15/Mcfe Industry leading 3-year average growth-adjusted recycle ratio: 4.8x Top quartile return on productive capital: 26% for 2014E Industry Leading Capital Efficiency and Recycle Ratio 2.0 Bcf/d of firm processing capacity by 3Q 2015 and 2.6 Bcf/d of firm gas takeaway in 2016 Liquids (NGLs and oil) expected to grow from 12% of 1Q 2014 production to 16% average in 2014 due to focus on liquids-rich development Significant Emphasis on Liquids Processing and Takeaway Capacity $1.5 billion of liquidity with current $2.0 billion in bank commitments Average cost of debt under 5% with first maturity in 2019 1.4 Tcfe hedged through 2019 at an average index price of $4.57/MMBtu and $95.22/Bbl Liquidity and Hedge Position Support High Growth Story Over 30 years as a team (over 20 years in unconventional) “Shale Pioneers” – early mover and driller of over 500 horizontal shale wells in the Barnett, Woodford, Marcellus and Utica Shales Outstanding Management Team 2 |
|
|
SIGNIFICANT MOMENTUM SINCE IPO 3 Net Production (MMcfe/d) Net Acres Liquids Production (Bbl/d) Note: “Current” denotes latest data per website presentation or Roadshow presentation where applicable. LQA = Latest Quarter Annualized LQA EBITDAX ($MM) 11% Bank Borrowing Base ($MM) 50% Firm Gas Takeaway (MMcf/d) Firms Liquids Takeaway (Bbl/d) Weighted Average Debt Cost (%) |
|
|
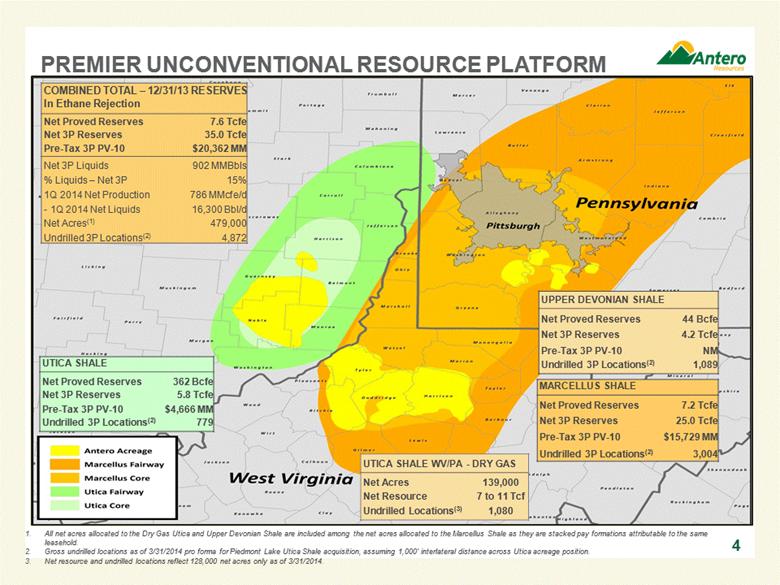
UPPER DEVONIAN SHALE Net Proved Reserves 44 Bcfe Net 3P Reserves 4.2 Tcfe Pre-Tax 3P PV-10 NM Undrilled 3P Locations(2) 1,089 PREMIER UNCONVENTIONAL RESOURCE PLATFORM All net acres allocated to the Dry Gas Utica and Upper Devonian Shale are included among the net acres allocated to the Marcellus Shale as they are stacked pay formations attributable to the same leasehold. Gross undrilled locations as of 3/31/2014 pro forma for Piedmont Lake Utica Shale acquisition, assuming 1,000’ interlateral distance across Utica acreage position. Net resource and undrilled locations reflect 128,000 net acres only as of 3/31/2014. COMBINED TOTAL – 12/31/13 RESERVES In Ethane Rejection Net Proved Reserves 7.6 Tcfe Net 3P Reserves 35.0 Tcfe Pre-Tax 3P PV-10 $20,362 MM Net 3P Liquids 902 MMBbls % Liquids – Net 3P 15% 1Q 2014 Net Production 786 MMcfe/d - 1Q 2014 Net Liquids 16,300 Bbl/d Net Acres(1) 479,000 Undrilled 3P Locations(2) 4,872 MARCELLUS SHALE Net Proved Reserves 7.2 Tcfe Net 3P Reserves 25.0 Tcfe Pre-Tax 3P PV-10 $15,729 MM Undrilled 3P Locations(2) 3,004 UTICA SHALE Net Proved Reserves 362 Bcfe Net 3P Reserves 5.8 Tcfe Pre-Tax 3P PV-10 $4,666 MM Undrilled 3P Locations(2) 779 4 UTICA SHALE WV/PA - DRY GAS Net Acres 139,000 Net Resource 7 to 11 Tcf Undrilled Locations(3) 1,080 |
|
|
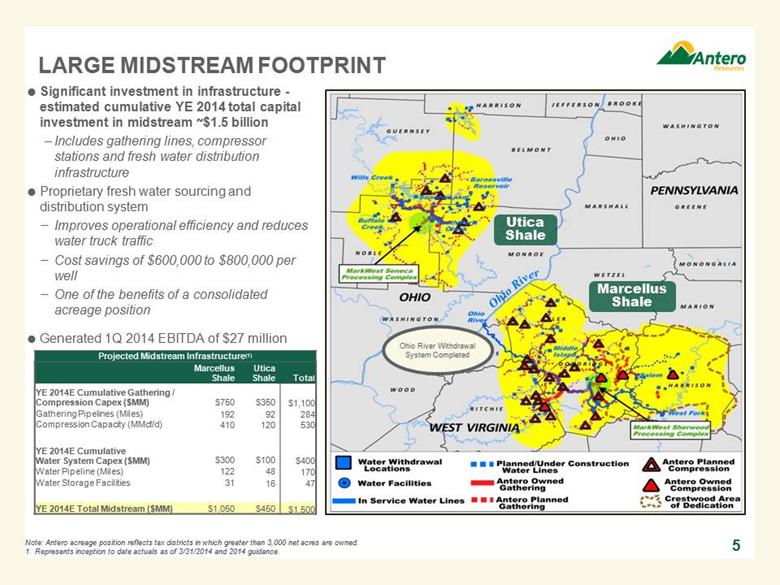
LARGE MIDSTREAM FOOTPRINT 5 Ohio River Withdrawal System Completed Significant investment in infrastructure - estimated cumulative YE 2014 total capital investment in midstream ~$1.5 billion Includes gathering lines, compressor stations and fresh water distribution infrastructure Proprietary fresh water sourcing and distribution system Improves operational efficiency and reduces water truck traffic Cost savings of $600,000 to $800,000 per well One of the benefits of a consolidated acreage position Generated 1Q 2014 EBITDA of $27 million Utica Shale Marcellus Shale Projected Midstream Infrastructure(1) Marcellus Shale Utica Shale Total YE 2014E Cumulative Gathering / Compression Capex ($MM) $750 $350 $1,100 Gathering Pipelines (Miles) 192 92 284 Compression Capacity (MMcf/d) 410 120 530 YE 2014E Cumulative Water System Capex ($MM) $300 $100 $400 Water Pipeline (Miles) 122 48 170 Water Storage Facilities 31 16 47 YE 2014E Total Midstream ($MM) $1,050 $450 $1,500 Note: Antero acreage position reflects tax districts in which greater than 3,000 net acres are owned. Represents inception to date actuals as of 3/31/2014 and 2014 guidance. |
|
|
INTEGRATED PORTFOLIO OF FIRM GAS & NGL TAKEAWAY 6 Odebrecht / Braskem Ascent Cracker (Pending Final Investment Decision) Antero Firm Takeaway Position in 2016 Mariner East II Pending Open Season |
|
|
7 AVERAGE NET DAILY PRODUCTION (MMcfe/d) 58% CAGR NET PROVED SEC RESERVES (Bcfe) 33% CAGR 2012 and 2013 proved reserves in ethane rejection. Midpoint of production guidance of 925-975 MMcfe/d for 2014. Based on midpoint of 45-50% production growth target for 2015 and 2016. Per current First Call estimate. STRONG TRACK RECORD OF GROWTH OPERATED GROSS WELLS SPUD Sold Woodford and Piceance EBITDAX ($MM) 80% Growth Guidance 45-50% Annual Growth Target |
|
|
Marcellus Shale – SW Liquids-Rich Marcellus Shale – SW Dry Gas Utica Shale – Liquids-Rich Marcellus Shale – Super-Rich Utica Shale – Wet Gas MULTI-YEAR DRILLING INVENTORY SUPPORTS LOW RISK, HIGH RETURN GROWTH PROFILE Large Inventory of Low Breakeven Price Projects(2) Well economics based on current strip pricing for natural gas, current strip pricing for 2014/2015 and $90 flat thereafter for WTI oil, NGLs at 55% of oil price and applicable firm transportation costs. Source: Credit Suisse report dated January 2014 – Break even price for 15% after tax rate-of-return; assumes $90.00/Bbl WTI. Calculated by Antero. Current 3 Yr. NYMEX Strip - $4.30/MMBtu 665 Locations 1,481 Locations 388 Locations 858 Locations $ / MMBtu NYMEX (Gas) 180 Locations 8 MARCELLUS SSL WELL ECONOMICS(1) UTICA WELL ECONOMICS(1) 1,000 71% of Marcellus locations are processable (1100-plus Btu) 73% of Utica locations are processable (1100-plus Btu) ` >2,700 Antero Liquids-Rich Locations Utica Shale – Dry Gas(3) 211 Locations |
|
|
LOWEST FINDING & DEVELOPMENT COST AMONG U.S. PRODUCERS 9 3-Year All-In F&D Cost – Excluding Revisions ($/Mcfe) through 2013 Source: Credit Suisse research dated 4/28/2014. Antero ranks as the most efficient finder and developer of reserves, on a per Mcfe basis, based on a recent 2011-2013 average all-in F&D cost analysis prepared by Credit Suisse |
|
|
INTEGRATED FIRM PROCESSING & GAS TAKEAWAY Infrastructure and commitments in place to handle strong production growth Portfolio of firm gas takeaway and sales and West Virginia and Ohio location minimizes basis risk 10 Total Capacity 1,950 Marcellus Utica Sherwood 1 Sherwood 2 Sherwood 3 Seneca 1 Seneca 2 Seneca 3 Growing Firm Processing Capacity Sherwood 5 Seneca 4 Sherwood 4 Sherwood 6 Antero Firm Gas Takeaway by 2016 Current basis data from Wells Fargo daily indications and various private quotes. 2013 % of Production Sold NYMEX 6% TCO 67% TETCO M2 5% Dom South 22% Sherwood 7 Primary AR Sales Points |
|
|
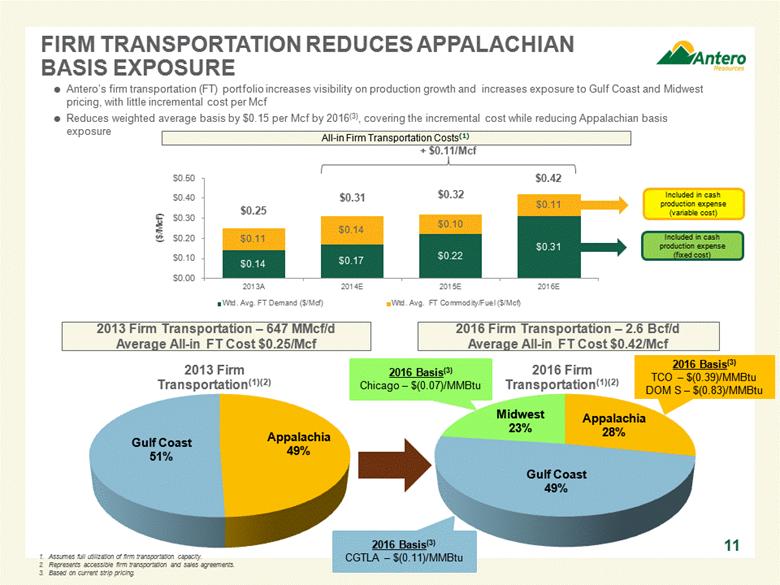
All-in Firm Transportation Costs(1) FIRM TRANSPORTATION REDUCES APPALACHIAN BASIS EXPOSURE 2013 Firm Transportation – 647 MMcf/d Average All-in FT Cost $0.25/Mcf 2016 Firm Transportation – 2.6 Bcf/d Average All-in FT Cost $0.42/Mcf + $0.11/Mcf 11 Antero’s firm transportation (FT) portfolio increases visibility on production growth and increases exposure to Gulf Coast and Midwest pricing, with little incremental cost per Mcf Reduces weighted average basis by $0.15 per Mcf by 2016(3), covering the incremental cost while reducing Appalachian basis exposure Included in cash production expense (fixed cost) Assumes full utilization of firm transportation capacity. Represents accessible firm transportation and sales agreements. Based on current strip pricing. Included in cash production expense (variable cost) $0.25 $0.31 $0.32 $0.42 2016 Basis(3) TCO – $(0.39)/MMBtu DOM S – $(0.83)/MMBtu 2016 Basis(3) Chicago – $(0.07)/MMBtu 2016 Basis(3) CGTLA – $(0.11)/MMBtu |
|
|
SIGNIFICANT LONG-TERM COMMODITY HEDGE POSITION 12 % HEDGE VOLUMES BY INDEX Average Index Hedge Price(1) Hedged Volume Current NYMEX Strip NATURAL GAS HEDGE POSITION 1. Reflects weighted average index price per annum based on volumes hedged and 6:1 gas to oil ratio. Antero has hedged ~3,000 Bbl/d for 2014, WTI hedges comprise ~1% of overall hedge book. ~$590 million mark-to-market unrealized gain based on current prices; additional hedge capacity remaining through 2019 1.4 Tcfe hedged from April 1, 2014 through year-end 2019 |
|
|
1Q 2014 REALIZATIONS Ethane Propane Iso Butane Normal Butane Natural Gasoline 1Q 2014 NGL Y-GRADE (C3+) REALIZATIONS 1Q 2014 NATURAL GAS REALIZATIONS ($/MCF) $33.93 $6.79 $9.25 $10.49 $1.23 13 Gulf Coast differential represents contractual deduct to NYMEX-based sales. Includes firm sales. Includes natural gas hedges. 1Q 2014 Hedged Volumes 664 MMBtu/d Region 1Q 2014 % Sales Average NYMEX Price Average Differential(2) Average BTU Upgrade Hedge Effect Average 1Q 2014 Realized Gas Price(3) Average Premium Appalachia 84% $4.94 $(0.23) $0.35 $0.03 $5.14 $0.20 Gulf Coast(1) 16% $4.94 $(0.27) $0.35 $(0.34) $4.71 $(0.23) Chicago 0% $4.94 - - - - - Total Wtd. Avg. 100% $4.94 $(0.24) $0.35 ($0.03) $5.02 $0.08 CGTLA 1% DOM S 24% NYMEX 44% TCO 31% 1Q 2014 HEDGED VOLUMES – BY INDEX $0.11 – premium to NYMEX (above current guidance) % of C3+ Bbl Ethane 2% Propane 55% Iso Butane 11% Normal Butane 15% Natural Gasoline 17% + |
|
|
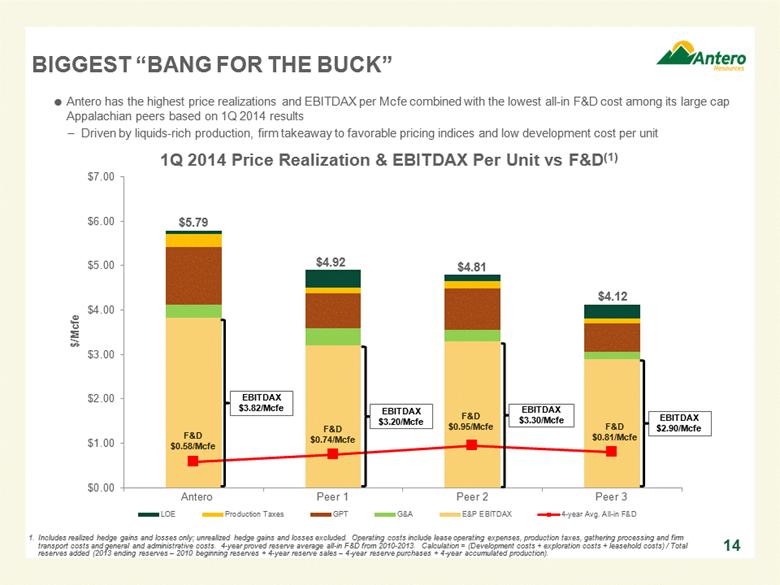
14 Includes realized hedge gains and losses only; unrealized hedge gains and losses excluded. Operating costs include lease operating expenses, production taxes, gathering processing and firm transport costs and general and administrative costs. 4-year proved reserve average all-in F&D from 2010-2013. Calculation = (Development costs + exploration costs + leasehold costs) / Total reserves added (2013 ending reserves – 2010 beginning reserves + 4-year reserve sales – 4-year reserve purchases + 4-year accumulated production). BIGGEST “BANG FOR THE BUCK” Antero has the highest price realizations and EBITDAX per Mcfe combined with the lowest all-in F&D cost among its large cap Appalachian peers based on 1Q 2014 results Driven by liquids-rich production, firm takeaway to favorable pricing indices and low development cost per unit 1Q 2014 Price Realization & EBITDAX Per Unit vs F&D(1) |
|
|
15 1Q 2014 Price Realizations ($/Mcfe)(2) 2014 Projected Growth (%)(1) Based on midpoint of 2014 production guidance for Antero Resources and large capitalization Appalachian peers (Cabot Oil & Gas, EQT Corp and Range Resources). Based on 3/31/2014 10-Qs for Antero and peers. Based on 2011-2013 average proved developed F&D cost per 12/31/2013 10-Ks for Antero and peers; definition included on page 33. Based on 2011-2013 average growth adjusted recycle ratio for Antero and peers; definition included on page 33. POSITIONED FOR GROWTH & PROFITABILITY 1Q 2014 EBITDAX/Mcfe(2) 3-Year PD F&D ($/Mcfe)(3) 3-Year Growth-Adjusted Recycle Ratio(4) Highest Growth & Highest Margin Large Cap E&P Focused On Marcellus & Utica 80% $3.82 |
|
|
ASSET OVERVIEW 16 |
|
|
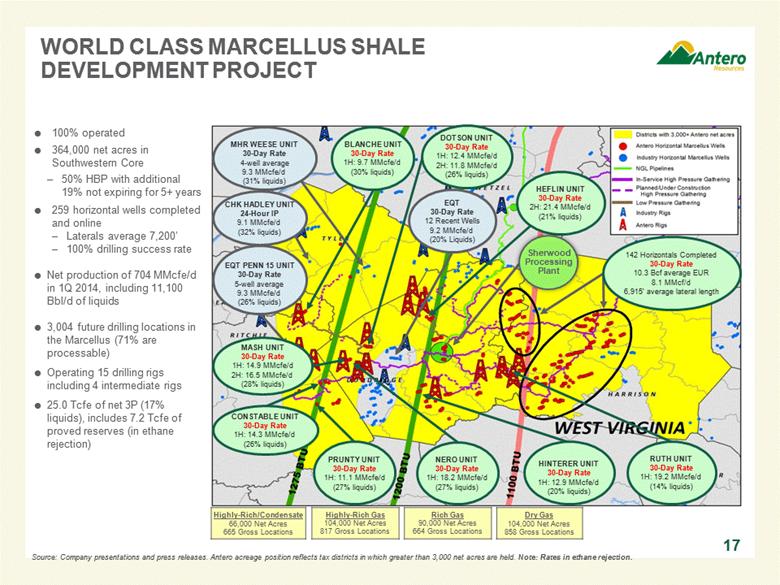
WORLD CLASS MARCELLUS SHALE DEVELOPMENT PROJECT 100% operated 364,000 net acres in Southwestern Core 50% HBP with additional 19% not expiring for 5+ years 259 horizontal wells completed and online Laterals average 7,200’ 100% drilling success rate Net production of 704 MMcfe/d in 1Q 2014, including 11,100 Bbl/d of liquids 3,004 future drilling locations in the Marcellus (71% are processable) Operating 15 drilling rigs including 4 intermediate rigs 25.0 Tcfe of net 3P (17% liquids), includes 7.2 Tcfe of proved reserves (in ethane rejection) 17 Highly-Rich Gas 104,000 Net Acres 817 Gross Locations Rich Gas 90,000 Net Acres 664 Gross Locations Dry Gas 104,000 Net Acres 858 Gross Locations Highly-Rich/Condensate 66,000 Net Acres 665 Gross Locations HEFLIN UNIT 30-Day Rate 2H: 21.4 MMcfe/d (21% liquids) MHR WEESE UNIT 30-Day Rate 4-well average 9.3 MMcfe/d (31% liquids) CHK HADLEY UNIT 24-Hour IP 9.1 MMcfe/d (32% liquids) EQT PENN 15 UNIT 30-Day Rate 5-well average 9.3 MMcfe/d (26% liquids) CONSTABLE UNIT 30-Day Rate 1H: 14.3 MMcfe/d (26% liquids) 142 Horizontals Completed 30-Day Rate 10.3 Bcf average EUR 8.1 MMcf/d 6,915’ average lateral length PRUNTY UNIT 30-Day Rate 1H: 11.1 MMcfe/d (27% liquids) HINTERER UNIT 30-Day Rate 1H: 12.9 MMcfe/d (20% liquids) RUTH UNIT 30-Day Rate 1H: 19.2 MMcfe/d (14% liquids) Sherwood Processing Plant EQT 30-Day Rate 12 Recent Wells 9.2 MMcfe/d (20% Liquids) Source: Company presentations and press releases. Antero acreage position reflects tax districts in which greater than 3,000 net acres are held. Note: Rates in ethane rejection. BLANCHE UNIT 30-Day Rate 1H: 9.7 MMcfe/d (30% liquids) DOTSON UNIT 30-Day Rate 1H: 12.4 MMcfe/d 2H: 11.8 MMcfe/d (26% liquids) MASH UNIT 30-Day Rate 1H: 14.9 MMcfe/d 2H: 16.5 MMcfe/d (28% liquids) NERO UNIT 30-Day Rate 1H: 18.2 MMcfe/d (27% liquids) |
|
|
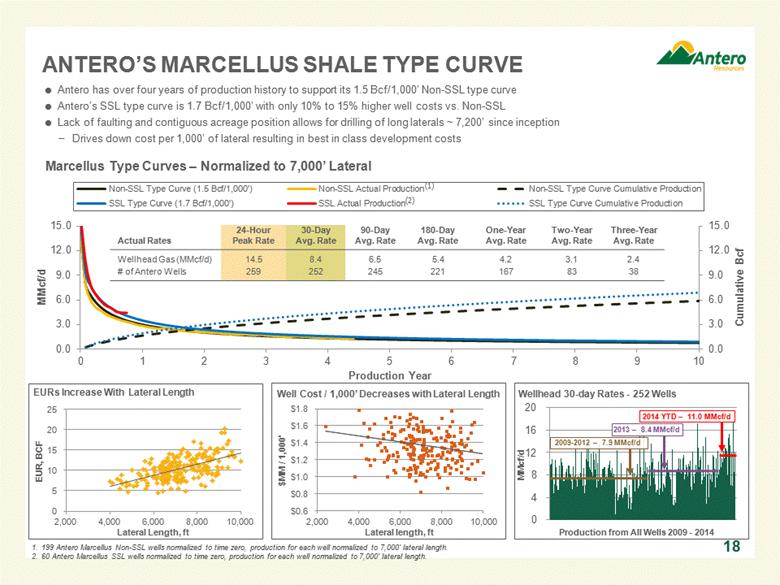
Antero has over four years of production history to support its 1.5 Bcf/1,000’ Non-SSL type curve Antero’s SSL type curve is 1.7 Bcf/1,000’ with only 10% to 15% higher well costs vs. Non-SSL Lack of faulting and contiguous acreage position allows for drilling of long laterals ~ 7,200’ since inception Drives down cost per 1,000’ of lateral resulting in best in class development costs ANTERO’S MARCELLUS SHALE TYPE CURVE 199 Antero Marcellus Non-SSL wells normalized to time zero, production for each well normalized to 7,000’ lateral length. 60 Antero Marcellus SSL wells normalized to time zero, production for each well normalized to 7,000’ lateral length. Marcellus Type Curves – Normalized to 7,000’ Lateral (1) 18 EURs Increase With Lateral Length Well Cost / 1,000’ Decreases with Lateral Length Wellhead 30-day Rates - 252 Wells 2009-2012 – 7.9 MMcf/d (2) 2013 – 8.4 MMcf/d 2014 YTD – 11.0 MMcf/d Actual Rates 24-Hour Peak Rate 30-Day Avg. Rate 90-Day Avg. Rate 180-Day Avg. Rate One-Year Avg. Rate Two-Year Avg. Rate Three-Year Avg. Rate Wellhead Gas (MMcf/d) 14.5 8.4 6.5 5.4 4.2 3.1 2.4 # of Antero Wells 259 252 245 221 167 83 38 |
|
|
MARCELLUS ROR% AND GAS PRICE SENSITIVITY 19 Assumes current strip pricing, market differentials and relevant transportation cost. Large portfolio of Highly-Rich Gas to Dry Gas locations Focused on drilling highly economic rich gas locations – rig symbols represent current rig location by regime Assumes $90/Bbl WTI oil and $50/Bbl NGL price (55% of WTI) NYMEX Price Sensitivity(1) ROR% at 3-Year NYMEX Gas Strip Highly-Rich Gas/Condensate: 105% Highly-Rich Gas: 65% Rich Gas: 29% Dry Gas: 19% 665 Locations 817 Locations 664 Locations 858 Locations Highly-Rich Gas/ Condensate Highly-Rich Gas Rich Gas Dry Gas Antero Rigs Employed |
|
|
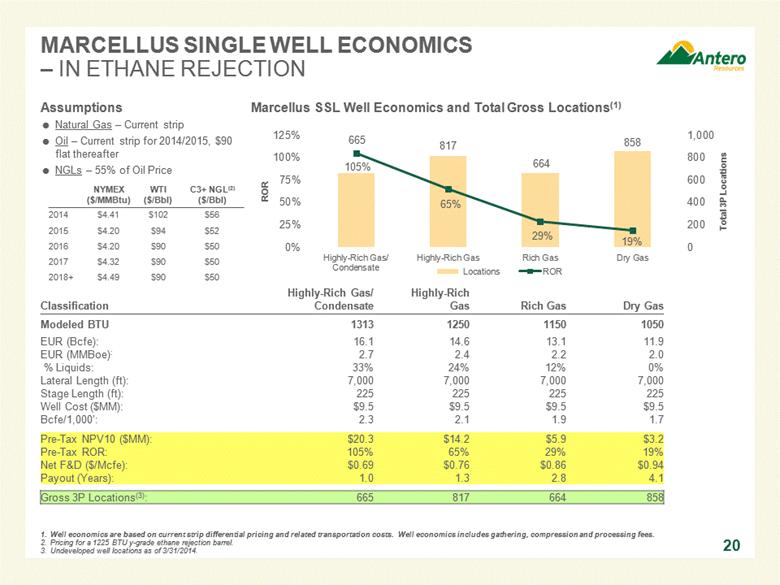
MARCELLUS SINGLE WELL ECONOMICS – IN ETHANE REJECTION 20 DRY GAS LOCATIONS RICH GAS LOCATIONS HIGHLY RICH GAS LOCATIONS Assumptions Natural Gas – Current strip Oil – Current strip for 2014/2015, $90 flat thereafter NGLs – 55% of Oil Price NYMEX ($/MMBtu) WTI ($/Bbl) C3+ NGL(2) ($/Bbl) 2014 $4.41 $102 $56 2015 $4.20 $94 $52 2016 $4.20 $90 $50 2017 $4.32 $90 $50 2018+ $4.49 $90 $50 Marcellus SSL Well Economics and Total Gross Locations(1) Classification Highly-Rich Gas/ Condensate Highly-Rich Gas Rich Gas Dry Gas Modeled BTU 1313 1250 1150 1050 EUR (Bcfe): 16.1 14.6 13.1 11.9 EUR (MMBoe): 2.7 2.4 2.2 2.0 % Liquids: 33% 24% 12% 0% Lateral Length (ft): 7,000 7,000 7,000 7,000 Stage Length (ft): 225 225 225 225 Well Cost ($MM): $9.5 $9.5 $9.5 $9.5 Bcfe/1,000’: 2.3 2.1 1.9 1.7 Pre-Tax NPV10 ($MM): $20.3 $14.2 $5.9 $3.2 Pre-Tax ROR: 105% 65% 29% 19% Net F&D ($/Mcfe): $0.69 $0.76 $0.86 $0.94 Payout (Years): 1.0 1.3 2.8 4.1 Gross 3P Locations(3): 665 817 664 858 Well economics are based on current strip differential pricing and related transportation costs. Well economics includes gathering, compression and processing fees. Pricing for a 1225 BTU y-grade ethane rejection barrel. Undeveloped well locations as of 3/31/2014. |
|
|
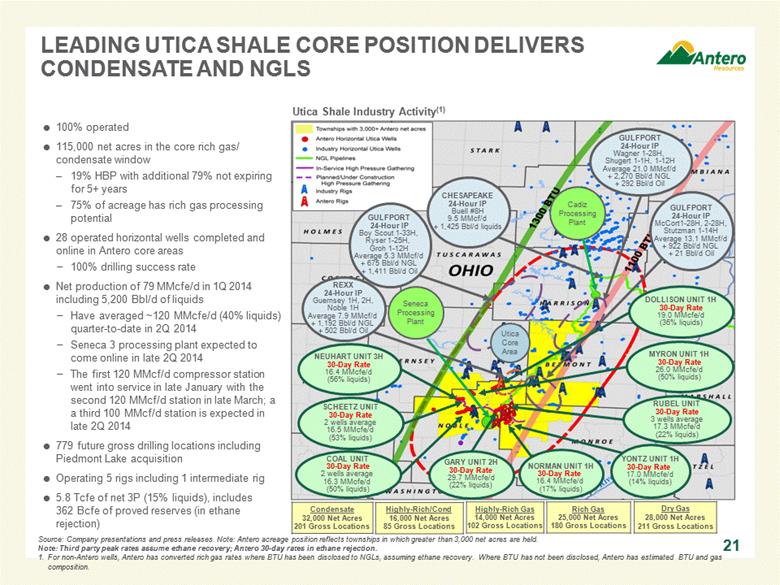
Source: Company presentations and press releases. Note: Antero acreage position reflects townships in which greater than 3,000 net acres are held. Note: Third party peak rates assume ethane recovery; Antero 30-day rates in ethane rejection. For non-Antero wells, Antero has converted rich gas rates where BTU has been disclosed to NGLs, assuming ethane recovery. Where BTU has not been disclosed, Antero has estimated BTU and gas composition. 100% operated 115,000 net acres in the core rich gas/ condensate window 19% HBP with additional 79% not expiring for 5+ years 75% of acreage has rich gas processing potential 28 operated horizontal wells completed and online in Antero core areas 100% drilling success rate Net production of 79 MMcfe/d in 1Q 2014 including 5,200 Bbl/d of liquids Have averaged ~120 MMcfe/d (40% liquids) quarter-to-date in 2Q 2014 Seneca 3 processing plant expected to come online in late 2Q 2014 The first 120 MMcf/d compressor station went into service in late January with the second 120 MMcf/d station in late March; a a third 100 MMcf/d station is expected in late 2Q 2014 779 future gross drilling locations including Piedmont Lake acquisition Operating 5 rigs including 1 intermediate rig 5.8 Tcfe of net 3P (15% liquids), includes 362 Bcfe of proved reserves (in ethane rejection) LEADING UTICA SHALE CORE POSITION DELIVERS CONDENSATE AND NGLS 21 Utica Shale Industry Activity(1) Seneca Processing Plant Cadiz Processing Plant CHESAPEAKE 24-Hour IP Buell #8H 9.5 MMcf/d + 1,425 Bbl/d liquids GULFPORT 24-Hour IP Boy Scout 1-33H, Ryser 1-25H, Groh 1-12H Average 5.3 MMcf/d + 675 Bbl/d NGL + 1,411 Bbl/d Oil REXX 24-Hour IP Guernsey 1H, 2H, Noble 1H Average 7.9 MMcf/d + 1,192 Bbl/d NGL + 502 Bbl/d Oil NORMAN UNIT 1H 30-Day Rate 16.4 MMcfe/d (17% liquids) YONTZ UNIT 1H 30-Day Rate 17.0 MMcfe/d (14% liquids) RUBEL UNIT 30-Day Rate 3 wells average 17.3 MMcfe/d (22% liquids) GULFPORT 24-Hour IP McCort1-28H, 2-28H, Stutzman 1-14H Average 13.1 MMcf/d + 922 Bbl/d NGL + 21 Bbl/d Oil GULFPORT 24-Hour IP Wagner 1-28H, Shugert 1-1H, 1-12H Average 21.0 MMcf/d + 2,270 Bbl/d NGL + 292 Bbl/d Oil Utica Core Area GARY UNIT 2H 30-Day Rate 29.7 MMcfe/d (22% liquids) Highly-Rich/Cond 16,000 Net Acres 85 Gross Locations Highly-Rich Gas 14,000 Net Acres 102 Gross Locations Rich Gas 25,000 Net Acres 180 Gross Locations Dry Gas 28,000 Net Acres 211 Gross Locations COAL UNIT 30-Day Rate 2 wells average 16.3 MMcfe/d (50% liquids) SCHEETZ UNIT 30-Day Rate 2 wells average 16.5 MMcfe/d (53% liquids) NEUHART UNIT 3H 30-Day Rate 16.4 MMcfe/d (56% liquids) Condensate 32,000 Net Acres 201 Gross Locations DOLLISON UNIT 1H 30-Day Rate 19.0 MMcfe/d (36% liquids) MYRON UNIT 1H 30-Day Rate 26.0 MMcfe/d (50% liquids) |
|
|
UTICA SHALE TYPE CURVES Antero has 28 core area wells online and up to 9 months of production history to support EUR regime type curves More recent wells with shorter stage length (SSL) completions (<240’ stages) are producing at or above the type curves Expect to utilize SSL completions for all future Utica Shale development All six Antero Highly-Rich and Rich Gas wells reside in the top 12 Ohio Utica wells placed online in 2013 (see table below) Condensate Regime: 18 Wells – 1.1 Bcfe/1,000’ (35% Liquids)(1) Highly-Rich Gas/Condensate Regime: 4 Wells – 1.9 Bcfe/1,000’ (26% Liquids)(1) Combined Highly-Rich Gas and Rich Gas Regimes: 6 Wells – Average 2.7 Bcfe/1,000’ (18% Liquids)(1)(2) Type curve and production normalized to 7,000’ lateral. EUR assumes ethane rejection and condensate converted to gas equivalent at 6:1. Represents average of Highly-Rich Gas type curve of 2.8 Bcfe/1,000’ (21% Liquids) and Rich Gas type curve of 2.6 Bcfe/1,000’ (14% Liquids). 22 Ticker COUNTY WELL_NAME DAYS Wellhead Equivalent MMcfe/d AR MONROE GARY UNIT 2H 67 1,347 20.1 GPOR BELMONT STUTZMAN 1-14H 175 2,074 11.8 AR MONROE ET RUBEL 2H 143 1,603 11.2 GPOR HARRISON WAGNER 3-28H 102 1,122 11.0 AR MONROE YONTZ UNIT 1H 137 1,445 10.5 AR MONROE ET RUBEL 3H 139 1,372 9.9 GPOR BELMONT MCCORT 1-28H 172 1,637 9.5 GPOR BELMONT MCCORT 2-28H 172 1,631 9.5 GPOR HARRISON WAGNER 2-28H 88 834 9.5 AR MONROE ET RUBEL 1H 136 1,266 9.3 GPOR BELMONT SHUGERT 1-12H 164 1,518 9.3 AR MONROE NORMAN UNIT 1H 137 1,262 9.2 Ohio Department of Natural Resources - YE 2013 |
|
|
UTICA ROR% AND GAS PRICE SENSITIVITY 23 NYMEX Price Sensitivity(1) 102 Locations ROR% at 3-Year NYMEX Gas Strip Condensate: 34% Highly-Rich Gas/Condensate: 127% Highly-Rich Gas: 183% Rich Gas: 117% Dry Gas: 72% Large portfolio of Highly-Rich Gas to Dry Gas locations Focused on drilling highly economic rich gas locations – rig symbols represent current rig location by regime Assumes $90/Bbl WTI oil and $50/Bbl NGL price (55% of WTI) Highly-Rich Gas Assumes current strip pricing, market differentials and relevant transportation cost. Highly-Rich Gas/Condensate Rich Gas Dry Gas Condensate 180 Locations 85 Locations 211 Locations 201 Locations |
|
|
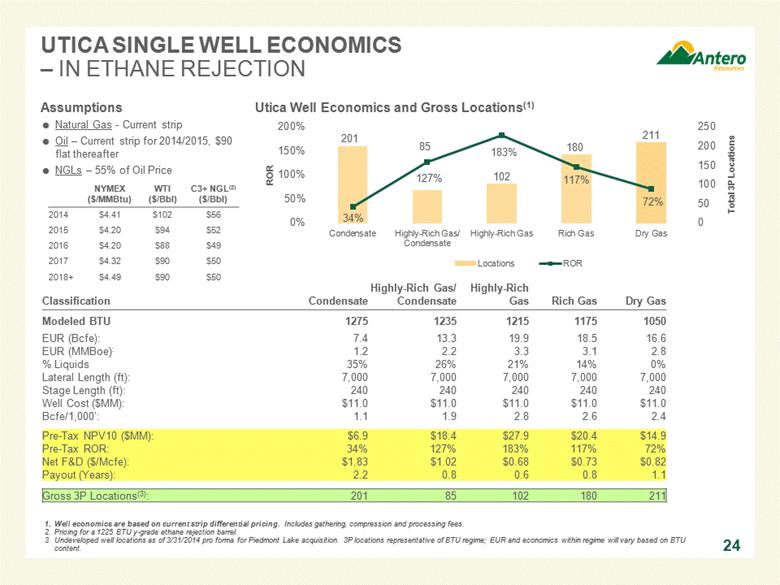
UTICA SINGLE WELL ECONOMICS – IN ETHANE REJECTION 24 DRY GAS LOCATIONS RICH GAS LOCATIONS HIGHLY RICH GAS LOCATIONS Utica Well Economics and Gross Locations(1) Classification Condensate Highly-Rich Gas/ Condensate Highly-Rich Gas Rich Gas Dry Gas Modeled BTU 1275 1235 1215 1175 1050 EUR (Bcfe): 7.4 13.3 19.9 18.5 16.6 EUR (MMBoe): 1.2 2.2 3.3 3.1 2.8 % Liquids 35% 26% 21% 14% 0% Lateral Length (ft): 7,000 7,000 7,000 7,000 7,000 Stage Length (ft): 240 240 240 240 240 Well Cost ($MM): $11.0 $11.0 $11.0 $11.0 $11.0 Bcfe/1,000’: 1.1 1.9 2.8 2.6 2.4 Pre-Tax NPV10 ($MM): $6.9 $18.4 $27.9 $20.4 $14.9 Pre-Tax ROR: 34% 127% 183% 117% 72% Net F&D ($/Mcfe): $1.83 $1.02 $0.68 $0.73 $0.82 Payout (Years): 2.2 0.8 0.6 0.8 1.1 Gross 3P Locations(3): 201 85 102 180 211 Well economics are based on current strip differential pricing. Includes gathering, compression and processing fees. Pricing for a 1225 BTU y-grade ethane rejection barrel. Undeveloped well locations as of 3/31/2014 pro forma for Piedmont Lake acquisition. 3P locations representative of BTU regime; EUR and economics within regime will vary based on BTU content. NYMEX ($/MMBtu) WTI ($/Bbl) C3+ NGL(2) ($/Bbl) 2014 $4.41 $102 $56 2015 $4.20 $94 $52 2016 $4.20 $88 $49 2017 $4.32 $90 $50 2018+ $4.49 $90 $50 Assumptions Natural Gas - Current strip Oil – Current strip for 2014/2015, $90 flat thereafter NGLs – 55% of Oil Price |
|
|
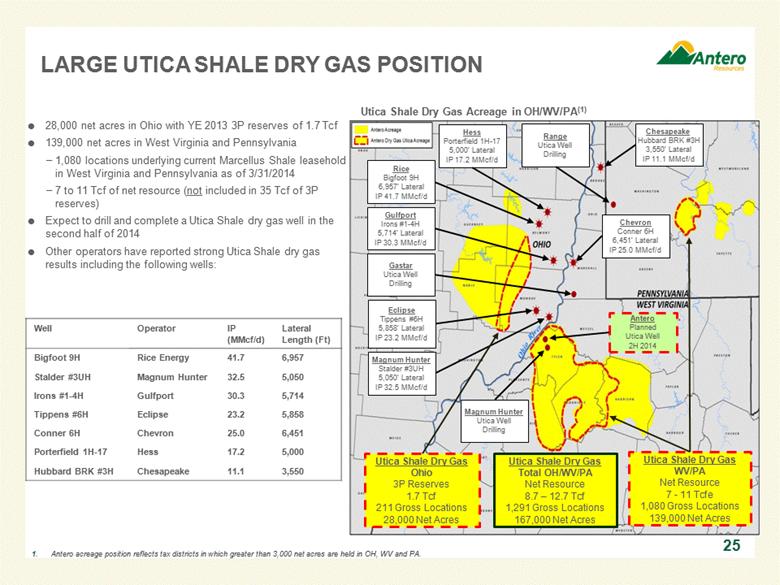
LARGE UTICA SHALE DRY GAS POSITION 25 28,000 net acres in Ohio with YE 2013 3P reserves of 1.7 Tcf 139,000 net acres in West Virginia and Pennsylvania 1,080 locations underlying current Marcellus Shale leasehold in West Virginia and Pennsylvania as of 3/31/2014 7 to 11 Tcf of net resource (not included in 35 Tcf of 3P reserves) Expect to drill and complete a Utica Shale dry gas well in the second half of 2014 Other operators have reported strong Utica Shale dry gas results including the following wells: Chesapeake Hubbard BRK #3H 3,550’ Lateral IP 11.1 MMcf/d Hess Porterfield 1H-17 5,000’ Lateral IP 17.2 MMcf/d Gulfport Irons #1-4H 5,714’ Lateral IP 30.3 MMcf/d Eclipse Tippens #6H 5,858’ Lateral IP 23.2 MMcf/d Magnum Hunter Stalder #3UH 5,050’ Lateral IP 32.5 MMcf/d Antero Planned Utica Well 2H 2014 Well Operator IP (MMcf/d) Lateral Length (Ft) Bigfoot 9H Rice Energy 41.7 6,957 Stalder #3UH Magnum Hunter 32.5 5,050 Irons #1-4H Gulfport 30.3 5,714 Tippens #6H Eclipse 23.2 5,858 Conner 6H Chevron 25.0 6,451 Porterfield 1H-17 Hess 17.2 5,000 Hubbard BRK #3H Chesapeake 11.1 3,550 Antero acreage position reflects tax districts in which greater than 3,000 net acres are held in OH, WV and PA. Magnum Hunter Utica Well Drilling Range Utica Well Drilling Chevron Conner 6H 6,451’ Lateral IP 25.0 MMcf/d Gastar Utica Well Drilling Utica Shale Dry Gas Acreage in OH/WV/PA(1) Rice Bigfoot 9H 6,957’ Lateral IP 41.7 MMcf/d Utica Shale Dry Gas WV/PA Net Resource 7 - 11 Tcfe 1,080 Gross Locations 139,000 Net Acres Utica Shale Dry Gas Ohio 3P Reserves 1.7 Tcf 211 Gross Locations 28,000 Net Acres Utica Shale Dry Gas Total OH/WV/PA Net Resource 8.7 – 12.7 Tcf 1,291 Gross Locations 167,000 Net Acres |
|
|
Keys to Execution Local Presence Antero has more than 4,500 contract personnel working full-time for Antero in West Virginia. 79% of these contract personnel are West Virginia residents. Land office in Ellenboro, WV Recently moved into new 50,000 square foot district office in Bridgeport, WV 139 of Antero’s 330 employees are located in West Virginia and Ohio Safety & Environmental Five company safety representatives and 45 safety consultants cover all material field operations 24/7 including drilling, completion, construction and pipelining 31 person company environmental staff plus outside consultants monitor all operations and perform baseline water well testing Central Fresh Water System & Water Recycling Numerous sources of water – building central water system to source water for completion Antero recycles over 95% of its flowback water with the remainder injected into disposal wells – no discharge to water treatment plants in West Virginia Natural Gas Vehicles (NGV) Antero supported the first natural gas fueling station in West Virginia which recently opened Antero has 30 NGV trucks and plans to continue to convert its truck fleet to NGV Pad Impact Mitigation Closed loop mud system – no mud pits Protective liners or mats on all well pads in addition to berms Natural Gas Powered Drilling Rigs & Frac Equipment Nine of Antero’s contracted drilling rigs are currently running on natural gas First natural gas powered clean fleet frac crew to begin operations this summer Green Completion Units All Antero well completions use green completion units for completion flowback, essentially eliminating methane emissions (full compliance with EPA 2015 requirements) LEED Gold Headquarters Building Recently moved into new corporate headquarters in Denver, Colorado Antero’s new corporate headquarters has been LEED Gold Certified HEALTH, SAFETY, ENVIRONMENT & COMMUNITY Antero Core Values: Protect Our People, Communities And The Environment Strong West Virginia Presence 79% of Antero Marcellus employees and contract workers are West Virginia residents Antero named Business of the Year for 2013 in Harrison County, West Virginia “For outstanding corporate citizenship and community involvement” Antero representatives recently participated in a ribbon cutting with the Governor of West Virginia for the grand opening of the first natural gas fueling station in the state; Antero supported the station with volume commitments for its NGV truck fleet 26 |
|
|
ANTERO KEY ATTRIBUTES 27 479,000 Net Acres in the Core Marcellus and Utica Shales “Triple Digit” Historical Production and Reserve Growth Low Cost Leader / High Return Projects Significant Processing and Takeaway Capacity Already in Place Clean Balance Sheet Supports High Growth Story “Forward Thinking” Management Team with a History of Success |
|
|
28 APPENDIX 28 |
|
|
CAPITALIZATION PRO FORMA CAPITALIZATION 29 ($ in millions) 3/31/2014 PF $600 MM Senior Notes 3/31/2014 (2),(3) Cash $13 $13 Senior Secured Revolving Credit Facility 745 431 7.25% Senior Notes Due 2019 260 0 6.00% Senior Notes Due 2020 525 525 5.375% Senior Notes Due 2021 1,000 1,000 5.125% Senior Notes Due 2022 0 600 Net Unamortized Premium 6 6 Total Debt $2,536 $2,562 Net Debt $2,523 $2,549 Shareholders' Equity $3,533 $3,533 Net Book Capitalization $6,056 $6,082 Enterprise Value(1) $18,767 $18,792 Financial & Operating Statistics LTM EBITDAX $804 $804 LQA EBITDAX $1,097 $1,097 LTM Interest Expense(2) $138 $121 Proved Reserves (Bcfe) (12/31/2013) 7,632 7,632 Proved Developed Reserves (Bcfe) (12/31/2013) 2,023 2,023 Credit Statistics Net Debt / LTM EBITDAX 3.1x 3.2x Net Debt / LQA EBITDAX 2.3x 2.3x LTM EBITDAX / Interest Expense 5.8x 6.6x Net Debt / Net Book Capitalization 41.7% 41.9% Net Debt / Proved Developed Reserves ($/Mcfe) $1.25 $1.26 Net Debt / Proved Reserves ($/Mcfe) $0.33 $0.33 Liquidity Credit Facility Commitments(4) $2,000 $2,000 Less: Borrowings (745) (431) Less: Letters of Credit (73) (73) Plus: Cash 13 13 Liquidity (Credit Facility + Cash) $1,195 $1,509 Equity valuation based on 262.0 million shares outstanding and a share price of $62.00 as of 5/28/2014. Enterprise value includes net debt. Pro forma interest expense adjusted for $1,578 million net proceeds from IPO priced on 10/14/2013 and $1,000 million 5.375% Senior Notes priced on 10/24/2013 net of fees; assumes $525 million 9.375% Senior Notes, $25 million 9.00% Senior Notes, $400 million 7.25% Senior Notes repaid at 3/31/2013 with residual cash used to repay bank debt. Based on $600 million 5.125% Senior Notes priced on 4/23/2014 net of fees; assumes $260 million of 7.25% Senior Notes and $315 million of bank debt repaid at 3/31/2013. Lender commitments under the facility increased to $2.0 billion from $1.5 billion on 5/5/2014; commitments can be expanded to the full $3.0 billion borrowing base upon bank approval. |
|
|
ANTERO – 2014 GUIDANCE 30 Key Variable 2014 Guidance Range Natural Gas Realized Price Premium to NYMEX ($/Mcf)(2) $0.00 - $0.10 NGL Realized Price (% of WTI) 53% - 57% Oil Realized Price Differential to NYMEX ($/Bbl) $(10.00) - $(12.00) Net Production (MMcfe/d) 925 - 975 Net Natural Gas Production (MMcf/d) 780 - 820 Net Liquids Production (Bbl/d) 24,000 – 26,000 Cash Production Expense ($/Mcfe)(3) $1.50 - $1.60 G&A Expense ($/Mcfe) $0.25 - $0.30 Total Wells Spud 193 Total Wells Completed 181 Capital Expenditure ($MM) Drilling & Completion $1,800 Midstream $750 Land $300 Total Capex ($MM) $2,850 Rig and well counts based on Antero guidance per Company press release dated 1/29/2014. Financial assumptions per Company press release dated 2/26/2014. Antero’s processed tailgate and unprocessed dry gas production is greater than 1000 BTU on average. Includes lease operating expenses, gathering, compression and transportation expenses and production taxes. Key 2014 Operating & Financial Assumptions(1) |
|
|
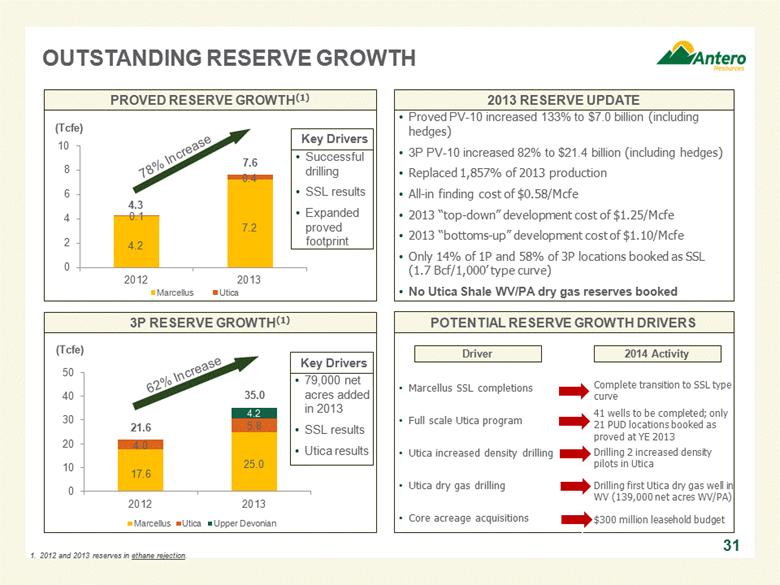
OUTSTANDING RESERVE GROWTH 2012 and 2013 reserves in ethane rejection. 31 PROVED RESERVE GROWTH(1) 3P RESERVE GROWTH(1) Proved PV-10 increased 133% to $7.0 billion (including hedges) 3P PV-10 increased 82% to $21.4 billion (including hedges) Replaced 1,857% of 2013 production All-in finding cost of $0.58/Mcfe 2013 “top-down” development cost of $1.25/Mcfe 2013 “bottoms-up” development cost of $1.10/Mcfe Only 14% of 1P and 58% of 3P locations booked as SSL (1.7 Bcf/1,000’ type curve) No Utica Shale WV/PA dry gas reserves booked POTENTIAL RESERVE GROWTH DRIVERS 2013 RESERVE UPDATE Marcellus SSL completions Full scale Utica program Utica increased density drilling Utica dry gas drilling Core acreage acquisitions Driver 2014 Activity Complete transition to SSL type curve 4.3 21.6 35.0 Successful drilling SSL results Expanded proved footprint 79,000 net acres added in 2013 SSL results Utica results 41 wells to be completed; only 21 PUD locations booked as proved at YE 2013 $300 million leasehold budget Drilling 2 increased density pilots in Utica Drilling first Utica dry gas well in WV (139,000 net acres WV/PA) Key Drivers |
|
|
FIRM TRANSPORTATION AND FIRM SALES PORTFOLIO 32 MMBtu/d Columbia 7/26/2009 – 9/30/2025 Firm Sales #1 10/1/2011– 10/31/2019 Firm Sales #2 10/1/2011 – 5/31/2017 Firm Sales #3 1/1/2013 – 5/31/2022 Momentum III 9/1/2012 – 12/31/2023 EQT 8/1/2012 – 6/30/2025 REX/MGT/ANR 7/1/2014 – 12/31/2034 Tennessee 11/1/2015– 9/30/2030 Midwest Gulf Coast Appalachia or Gulf Coast Appalachia Appalachia |
|
|
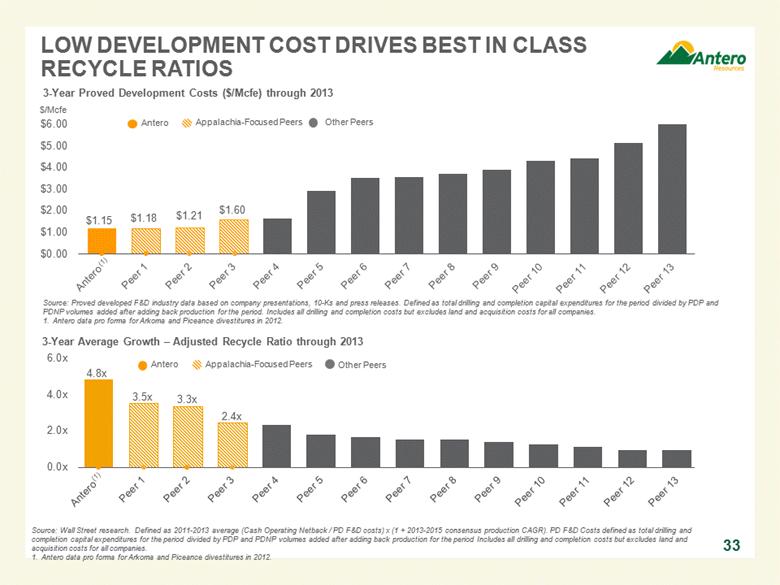
3-Year Average Growth – Adjusted Recycle Ratio through 2013 LOW DEVELOPMENT COST DRIVES BEST IN CLASS RECYCLE RATIOS 33 Source: Proved developed F&D industry data based on company presentations, 10-Ks and press releases. Defined as total drilling and completion capital expenditures for the period divided by PDP and PDNP volumes added after adding back production for the period. Includes all drilling and completion costs but excludes land and acquisition costs for all companies. Antero data pro forma for Arkoma and Piceance divestitures in 2012. 3-Year Proved Development Costs ($/Mcfe) through 2013 Antero Appalachia-Focused Peers Source: Wall Street research. Defined as 2011-2013 average (Cash Operating Netback / PD F&D costs) x (1 + 2013-2015 consensus production CAGR). PD F&D Costs defined as total drilling and completion capital expenditures for the period divided by PDP and PDNP volumes added after adding back production for the period Includes all drilling and completion costs but excludes land and acquisition costs for all companies. Antero data pro forma for Arkoma and Piceance divestitures in 2012. Antero Appalachia-Focused Peers $/Mcfe (1) (1) Other Peers |
|
|
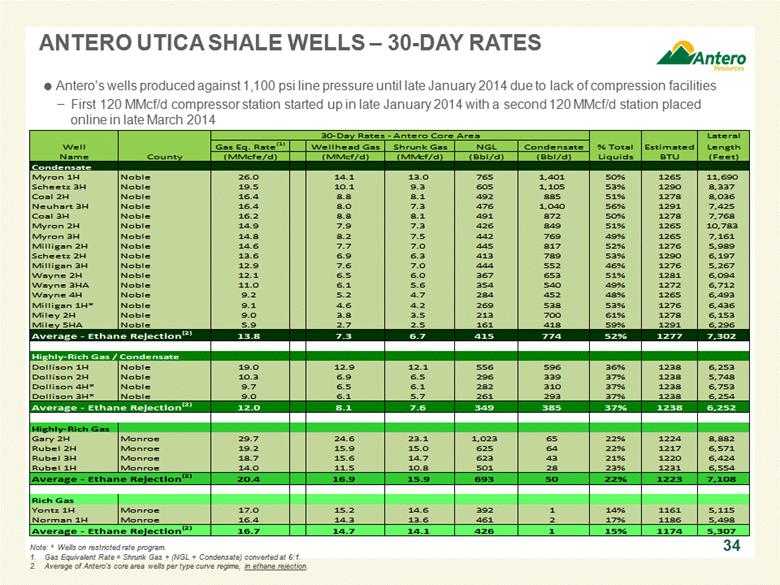
Note: * Wells on restricted rate program. Gas Equivalent Rate = Shrunk Gas + (NGL + Condensate) converted at 6:1. Average of Antero’s core area wells per type curve regime, in ethane rejection. ANTERO UTICA SHALE WELLS – 30-DAY RATES 34 Antero’s wells produced against 1,100 psi line pressure until late January 2014 due to lack of compression facilities First 120 MMcf/d compressor station started up in late January 2014 with a second 120 MMcf/d station placed online in late March 2014 Lateral Well Gas Eq. Rate (1) Wellhead Gas Shrunk Gas NGL Condensate % Total Estimated Length Name County (MMcfe/d) (MMcf/d) (MMcf/d) (Bbl/d) (Bbl/d) Liquids BTU (Feet) Condensate Myron 1H Noble 26.0 14.1 13.0 765 1,401 50% 1265 11,690 Scheetz 3H Noble 19.5 10.1 9.3 605 1,105 53% 1290 8,337 Coal 2H Noble 16.4 8.8 8.1 492 885 51% 1278 8,036 Neuhart 3H Noble 16.4 8.0 7.3 476 1,040 56% 1291 7,425 Coal 3H Noble 16.2 8.8 8.1 491 872 50% 1278 7,768 Myron 2H Noble 14.9 7.9 7.3 426 849 51% 1265 10,783 Myron 3H Noble 14.8 8.2 7.5 442 769 49% 1265 7,161 Milligan 2H Noble 14.6 7.7 7.0 445 817 52% 1276 5,989 Scheetz 2H Noble 13.6 6.9 6.3 413 789 53% 1290 6,197 Milligan 3H Noble 12.9 7.6 7.0 444 552 46% 1276 5,267 Wayne 2H Noble 12.1 6.5 6.0 367 653 51% 1281 6,094 Wayne 3HA Noble 11.0 6.1 5.6 354 540 49% 1272 6,712 Wayne 4H Noble 9.2 5.2 4.7 284 452 48% 1265 6,493 Milligan 1H* Noble 9.1 4.6 4.2 269 538 53% 1276 6,436 Miley 2H Noble 9.0 3.8 3.5 213 700 61% 1278 6,153 Miley 5HA Noble 5.9 2.7 2.5 161 418 59% 1291 6,296 13.8 7.3 6.7 415 774 52% 1277 7,302 Highly-Rich Gas / Condensate Dollison 1H Noble 19.0 12.9 12.1 556 596 36% 1238 6,253 Dollison 2H Noble 10.3 6.9 6.5 296 339 37% 1238 5,748 Dollison 4H* Noble 9.7 6.5 6.1 282 310 37% 1238 6,753 Dollison 3H* Noble 9.0 6.1 5.7 261 293 37% 1238 6,254 12.0 8.1 7.6 349 385 37% 1238 6,252 Highly-Rich Gas Gary 2H Monroe 29.7 24.6 23.1 1,023 65 22% 1224 8,882 Rubel 2H Monroe 19.2 15.9 15.0 625 64 22% 1217 6,571 Rubel 3H Monroe 18.7 15.6 14.7 623 43 21% 1220 6,424 Rubel 1H Monroe 14.0 11.5 10.8 501 28 23% 1231 6,554 20.4 16.9 15.9 693 50 22% 1223 7,108 Rich Gas Yontz 1H Monroe 17.0 15.2 14.6 392 1 14% 1161 5,115 Norman 1H Monroe 16.4 14.3 13.6 461 2 17% 1186 5,498 16.7 14.7 14.1 426 1 15% 1174 5,307 30-Day Rates - Antero Core Area Average - Ethane Rejection (2) Average - Ethane Rejection (2) Average - Ethane Rejection (2) Average - Ethane Rejection (2) |
|
|
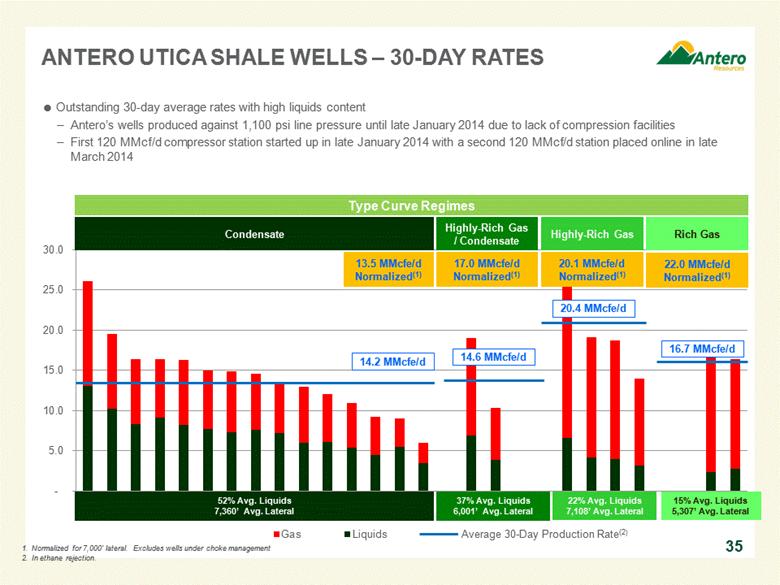
35 Condensate Highly-Rich Gas / Condensate Highly-Rich Gas Rich Gas ANTERO UTICA SHALE WELLS – 30-DAY RATES 37% Avg. Liquids 6,001’ Avg. Lateral 22% Avg. Liquids 7,108’ Avg. Lateral 15% Avg. Liquids 5,307’ Avg. Lateral Outstanding 30-day average rates with high liquids content Antero’s wells produced against 1,100 psi line pressure until late January 2014 due to lack of compression facilities First 120 MMcf/d compressor station started up in late January 2014 with a second 120 MMcf/d station placed online in late March 2014 Type Curve Regimes Normalized for 7,000’ lateral. Excludes wells under choke management In ethane rejection. 52% Avg. Liquids 7,360’ Avg. Lateral 14.2 MMcfe/d 14.6 MMcfe/d 20.4 MMcfe/d 16.7 MMcfe/d 13.5 MMcfe/d Normalized(1) 17.0 MMcfe/d Normalized(1) 20.1 MMcfe/d Normalized(1) 22.0 MMcfe/d Normalized(1) |
|
|
CONSIDERABLE RESERVE BASE WITH ETHANE OPTIONALITY 40 year proved reserve life based on 2013 production Reserve base provides significant exposure to liquids-rich projects 3P reserves of over 2.2 BBbl of NGLs and condensate in ethane recovery mode; 33% liquids Ethane rejection occurs when ethane is left in the wellhead gas stream as the gas is processed, rather than being separated out and sold as a liquid after fractionation. When ethane is left in the gas stream, the BTU content of the residue gas at the outlet of the processing plant is higher. Producers will elect to “reject” ethane when the price received for the higher BTU residue gas is greater than the price received for the ethane being sold as a liquid after fractionation. When ethane is recovered, the BTU content of the residue gas is lower, but a producer is then able to recover the value of the ethane sold as a separate NGL product. ETHANE REJECTION(1) ETHANE RECOVERY(1) 36 Marcellus – 25.0 Tcfe Utica – 5.8 Tcfe Upper Devonian – 4.2 Tcfe 35.0 Tcfe Gas – 29.6 Tcf Oil – 91 MMBbls NGLs – 811 MMBbls Marcellus – 29.5 Tcfe Utica – 6.7 Tcfe Upper Devonian – 4.7 Tcfe 40.8 Tcfe Gas – 27.4 Tcf Oil – 91 MMBbls NGLs – 2,151 MMBbls 15% Liquids 33% Liquids |
|
|
MARCELLUS SHALE RICH GAS – LIQUIDS AND PROCESSING UPGRADE Based on current strip pricing. Assumes $4.25/MMBtu NYMEX, $90.00/Bbl WTI and current NGL spot prices. 0.894, 1.972 and 2.630 (ethane rejection) GPMs used, all processing costs, shrink and fuel included. No NYMEX basis differential assumed. Current – Ethane Rejection (1076 BTU) 9% shrink (1109 BTU) 12% shrink (1118 BTU) 14% shrink $/Wellhead Mcf(1)(2) ($/Mcf) Marcellus Shale rich gas and highly-rich gas acreage provides a significant advantage in well economics – assuming $4.25/MMBtu NYMEX, $90.00/Bbl WTI and current spot NGL pricing(1) 37 +$0.68 Upgrade +$2.05 Upgrade +$3.18 Upgrade Highly-Rich Gas Dry Gas NGLs (C3+) $0.95 NGLs (C3+) $2.21 NGLs (C3+) $3.00 Condensate $0.16 Condensate $0.55 Highly-Rich/ Condensate Rich Gas |
|
|
ANTERO 2014 CAPITAL BUDGET 2014E 38 $2.85 Billion $2.65 Billion 2014E 2013 2013 |
|
|
POSITIVE RATINGS MOMENTUM Moody’s / S&P Historical Credit Ratings “”The positive outlook reflects the potential for a positive rating action if the company is able to continue to increase reserves and production in the Marcellus and Utica shales, increase liquids production, while continuing to improve credit measures.” - S&P Credit Research, March 2014 “An upgrade could be considered if debt / average daily production is sustained below $20,000 per boe and debt / proved-developed reserves is sustained below $8.00 per boe. An upgrade would also be contingent on Antero maintaining unleveraged cash margins greater than $25.00 per boe and retained cash flow to debt over 40% as it builds out infrastructure needs to support production growth.”
- Moody’s Credit Research, October 2013 Credit Rating (Moody’s / S&P) Ba3 / BB- B1 / B+ B2 / B B3 / B- 9/1/2010 2/24/2011 5/31/2012 10/21/2013 2/18//2014 2/28/2012 11/28/2011 8/27/2011 5/27/2011 Ba2 / BB Ba1 / BB+ Caa1 / CCC+ (1) ___________________________ Represents corporate credit rating of Antero Resources Corporation / Antero Resources LLC. Baa3 / BBB- Moody’s Upgrade Criteria S&P Upgrade Criteria 39 |
|
|
BALANCE SHEET POSITIONED FOR LONG-TERM GROWTH PRO FORMA DEBT MATURITY PROFILE (1) WEIGHTED AVERAGE INTEREST RATE AND MATURITY(1) 40 As of 3/31/2014, pro forma for the May senior notes offering and redemption of the remaining 7.25% senior notes and $315 million of senior secured debt. Current yields of senior notes tranches represent the current yield-to-worst per Bloomberg. Represents weighted average interest rate under the revolving credit facility as of 3/31/2014. Senior Secured Revolving Credit Facility Senior Notes The recent bond offerings, at progressively lower coupons, have allowed Antero to reduce its cost of debt to approximately 5.0% and enhance liquidity while extending the average debt maturity to June 2021 Cost of debt below 5%, average debt maturity beyond 7 years ($ in millions) Pro Forma Interest Current Maturity Maturity 03/31/14 Rate Yield (2) (Years) (Date) Senior Secured Revolving Credit Facility $431 1.940% (3) 1.940% (3) 5.1 May-19 6.0% Senior Notes due 2020 525 6.000% 3.906% 6.7 Dec-20 5.375% Senior Notes due 2021 1,000 5.375% 4.922% 7.6 Nov-21 5.125% Senior Notes due 2022 600 5.125% 4.655% 8.7 Dec-22 Total Long-Term Debt $2,556 Weighted Average: 4.865% 4.148% 7.2 Jun-21 |
|
|
U.S. INCREMENTAL GAS SUPPLY BREAK-EVEN PRICE CURVE(1) 41 Low cost, liquids-rich Utica and Marcellus Shales will remain attractive in most commodity price environments Utica Shale SW (Rich) Marcellus Shale Source: Credit Suisse report dated January 2014 – Break even price for 15% after tax rate-of-return; assumes $90.00/Bbl WTI NE (Dry) Marcellus Shale Eagle Ford Shale MARCELLUS & UTICA – ADVANTAGED ECONOMICS |
|
|
CAUTIONARY NOTE The SEC permits oil and gas companies, in their filings with the SEC, to disclose only proved, probable and possible reserve estimates (collectively, “3P”). Antero has provided internally generated estimates for proved, probable and possible reserves in this presentation in accordance with SEC guidelines and definitions. The estimates of proved, probable and possible reserves as of December 31, 2013 included in this presentation have been audited by Antero’s third-party engineers. Unless otherwise noted, reserve estimates are as of December 31, 2013, in ethane rejection and strip pricing. Actual quantities that may be ultimately recovered from Antero’s interests may differ substantially from the estimates in this presentation. Factors affecting ultimate recovery include the scope of Antero’s ongoing drilling program, which will be directly affected by commodity prices, the availability of capital, drilling and production costs, availability of drilling services and equipment, drilling results, lease expirations, transportation constraints, regulatory approvals and other factors; and actual drilling results, including geological and mechanical factors affecting recovery rates. In this presentation: “3P reserves” refer to Antero’s estimated aggregate proved, probable and possible reserves as of December 31, 2013. The SEC prohibits companies from aggregating proved, probable and possible reserves in filings with the SEC due to the different levels of certainty associated with each reserve category. “EUR,” or “Estimated Ultimate Recovery,” refers to Antero’s internal estimates of per well hydrocarbon quantities that may be potentially recovered from a hypothetical future well completed as a producer in the area. These quantities do not necessarily constitute or represent reserves within the meaning of the Society of Petroleum Engineer’s Petroleum Resource Management System or the SEC’s oil and natural gas disclosure rules. “Condensate” refers to gas having a heat content between 1250 BTU and 1300 BTU in the Utica Shale. “Highly-Rich Gas/Condensate” refers to gas having a heat content between 1275 BTU and 1350 BTU in the Marcellus Shale and 1225 BTU and 1250 BTU in the Utica Shale. “Highly-Rich Gas” refers to gas having a heat content between 1200 BTU and 1275 BTU in the Marcellus Shale and 1200 BTU and 1225 BTU in the Utica Shale. “Rich Gas” refers to gas having a heat content of between 1100 BTU and 1200 BTU. “Dry Gas” refers to gas containing insufficient quantities of hydrocarbons heavier than methane to allow their commercial extraction or to require their removal in order to render the gas suitable for fuel use. Regarding Hydrocarbon Quantities 42 |