Antero Resources Strategic Announcements October 9, 2018
Legal Disclaimer NO OFFER OR SOLICITATION This presentation relates to a proposed business combination transaction (the “Transaction”) AM and AMGP. This presentation is for informational purposes only and does not constitute an offer to sell or the solicitation of an offer to buy any securities or a solicitation of any vote or approval, in any jurisdiction, pursuant to the Transaction or otherwise, nor shall there be any sale, issuance, exchange or transfer of the securities referred to in this document in any jurisdiction in contravention of applicable law. No offer of securities shall be made except by means of a prospectus meeting the requirements of Section 10 of the Securities Act of 1933, as amended. IMPORTANT ADDITIONAL INFORMATION In connection with the Transaction, AMGP will file with the U.S. Securities and Exchange Commission (“SEC”) a registration statement on Form S-4, that will include a joint proxy statement of AM and AMGP and a prospectus of AMGP. The Transaction will be submitted to AM’s unitholders and AMGP’s shareholders for their consideration. AM and AMGP may also file other documents with the SEC regarding the Transaction. The definitive joint proxy statement/prospectus will be sent to the shareholders of AMGP and unitholders of AM. This document is not a substitute for the registration statement and joint proxy statement/prospectus that will be filed with the SEC or any other documents that AMGP or AM may file with the SEC or send to shareholders of AMGP or unitholders of AM in connection with the Transaction. INVESTORS AND SECURITY HOLDERS OF ANTERO MIDSTREAM AND AMGP ARE URGED TO READ THE REGISTRATION STATEMENT AND THE JOINT PROXY STATEMENT/PROSPECTUS REGARDING THE TRANSACTION WHEN IT BECOMES AVAILABLE AND ALL OTHER RELEVANT DOCUMENTS THAT ARE FILED OR WILL BE FILED WITH THE SEC, AS WELL AS ANY AMENDMENTS OR SUPPLEMENTS TO THESE DOCUMENTS, CAREFULLY AND IN THEIR ENTIRETY BECAUSE THEY WILL CONTAIN IMPORTANT INFORMATION ABOUT THE TRANSACTION AND RELATED MATTERS. Investors and security holders will be able to obtain free copies of the registration statement and the joint proxy statement/prospectus (when available) and all other documents filed or that will be filed with the SEC by AMGP or AM through the website maintained by the SEC at http://www.sec.gov. Copies of documents filed with the SEC by AM will be made available free of charge on AM’s website at http://investors.anteromidstream.com/investor-relations/AM, under the heading “SEC Filings,” or by directing a request to Investor Relations, Antero Midstream Partners LP, 1615 Wynkoop Street, Denver, Colorado 75219, Tel. No. (303) 357-7310. Copies of documents filed with the SEC by AMGP will be made available free of charge on AMGP’s website at http://investors.anteromidstreamgp.com/Investor-Relations/AMGP or by directing a request to Investor Relations, Antero Midstream GP LP, 1615 Wynkoop Street, Denver, Colorado 75219, Tel. No. (303) 357-7310. PARTICIPANTS IN THE SOLICITATION AMGP, AM, AR and the directors and executive officers of AMGP and AM’s respective general partners and of AR may be deemed to be participants in the solicitation of proxies in respect to the Transaction. Information regarding the directors and executive officers of AM’s general partner is contained in AM’s 2018 Annual Report on Form 10-K filed with the SEC on February 13, 2018, and certain of its Current Reports on Form 8-K. You can obtain a free copy of this document at the SEC’s website at http://www.sec.gov or by accessing AM’s website at http://www.anteromidstream.com. Information regarding the executive officers and directors of AMGP’s general partner is contained in AMGP’s 2018 Annual Report on Form 10-K filed with the SEC on February 13, 2018 and certain of its Current Reports on Form 8-K. You can obtain a free copy of this document at the SEC’s website at www.sec.gov or by accessing the AMGP’s website at http://www.anteromidstream.com. Information regarding the executive officers and directors of AR is contained in AR’s 2018 Annual Report on Form 10-K filed with the SEC on February 13, 2018 and certain of its Current Reports on Form 8-K. You can obtain a free copy of this document at the SEC’s website at www.sec.gov or by accessing the AMGP’s website at http:// www.anteroresources.com. Investors may obtain additional information regarding the interests of those persons and other persons who may be deemed participants in the Transaction by reading the joint proxy statement/prospectus regarding the Transaction when it becomes available. You may obtain free copies of this document as described above. 2
Legal Disclaimer This presentation includes “forward-looking statements.” Such forward-looking statements are subject to a number of risks and uncertainties, many of which are beyond AR’s control. All statements, except for statements of historical fact, made in this presentation regarding activities, events or developments AR expects, believes or anticipates will or may occur in the future, such as the expected sources of funding and timing for completion of the share repurchase program if at all, the expected consideration to be received in connection with the closing of the Transaction, the timing of the consummation of the Transaction, if at all, the extent to which AR will be shielded from tax payments associated with the Transaction, pro forma AM dividend and DCF coverage targets, estimated pro forma AM dividend CAGR and leverage metrics, AR’s expected ability to return capital to investors and targeted leverage metrics, AR’s estimated unhedged EBITDAX multiples, future plans for processing plants and fractionators, AR’s estimated production and the expected impact of Mariner East 2 on AR’s NGL pricing, are forward-looking statements within the meaning of Section 27A of the Securities Act of 1933 and Section 21E of the Securities Exchange Act of 1934. All forward-looking statements speak only as of the date of this presentation. Although AR believes that the plans, intentions and expectations reflected in or suggested by the forward-looking statements are reasonable, there is no assurance that these plans, intentions or expectations will be achieved. Therefore, actual outcomes and results could materially differ from what is expressed, implied or forecast in such statements. AR cautions you that these forward-looking statements are subject to all of the risks and uncertainties, most of which are difficult to predict and many of which are beyond the AR’s control, incident to the exploration for and development, production, gathering and sale of natural gas, NGLs and oil. These risks include, but are not limited to, commodity price volatility, inflation, lack of availability of drilling and production equipment and services, environmental risks, drilling and other operating risks, regulatory changes, the uncertainty inherent in estimating natural gas and oil reserves and in projecting future rates of production, cash flow and access to capital, the timing of development expenditures, and the other risks described under the heading "Item 1A. Risk Factors" in AR’s Annual Report on Form 10-K for the year ended December 31, 2017. This presentation includes certain financial measures that are not calculated in accordance with U.S. generally accepted accounting principles (“GAAP”). These measures include (i) Consolidated Adjusted EBITDAX, (ii) Stand-Alone Adjusted EBITDAX, (iii) Consolidated Adjusted Operating Cash Flow, (iv) Stand-Alone Adjusted Operating Cash Flow, (v) Free Cash Flow. Please see “Antero Definitions” and “Antero Non-GAAP Measures” for the definition of each of these measures as well as certain additional information regarding these measures, including the most comparable financial measures calculated in accordance with GAAP. Antero Resources Corporation is denoted as “AR” in the presentation, Antero Midstream Partners LP is denoted as “AM” and Antero Midstream GP LP is denoted as “AMGP”, which are their respective New York Stock Exchange ticker symbols. 3
Special Committee Process Objectives Achieve a “Win-Win-Win” Transaction Across the Antero Family Improve the financial profile and deliver value to all three Antero equities including AR, AM and AMGP Maintain target distributions to AM unitholders including AR, with strong coverage Simplify the Structure and Unlock Shareholder Value Simplify the structure for current and future investors Eliminate the eventual IDR drag on AM cash flow growth and cost of capital Maintain Antero’s Integrated Strategy & Long-Term Outlook Maintain senior management’s long-term vision to build the most integrated NGL and natural gas business in the U.S. Further Align the Interest of All Antero Equity Holders and Management Remove the perceived alignment of interest questions related to management/PE sponsor ownership of GP/IDRs relative to AR shareholders 1 2 3 4 While evaluating potential alternatives to increase shareholder value, there were a number of key objectives: Return Capital to AR Shareholders Capitalize on opportunity to repurchase shares at a discount to both intrinsic value and relative value of comparable elite operators Return Capital while maintaining trajectory to IG rating profile at AR 5 4
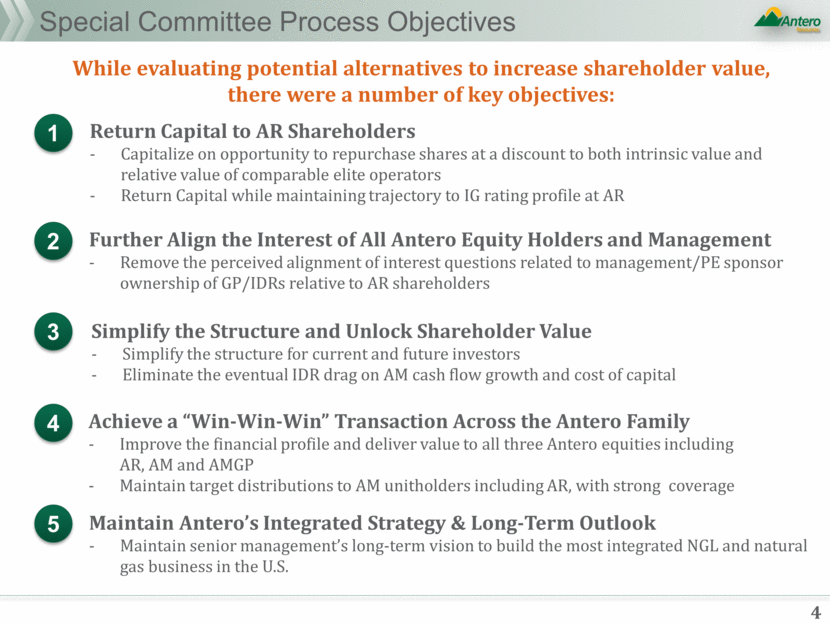
AR Strategic Announcements AMGP to acquire AM in a simplification transaction creating “New AM” AR to receive ~$300 million of cash and 158 MM shares of New AM IDRs eliminated in New AM simplified structure Cash taxes shielded at the AR level through NOLs $3.0 Billion of NOLs as of December 31, 2017 AR does not expect to pay material cash taxes through at least 2022 Double digit accretion to AM unitholders on a distributable cash flow (DCF) basis Resulting entity is a C-corp for tax AND governance purposes New AM will have a ‘best-in-class’ growth, coverage and leverage profile New AM will have a larger public float, and is expected to benefit from broader institutional ownership and enhanced trading liquidity as a C-Corp Results in AR being the largest shareholder in the pro forma midstream entity ~ 31% Expected to close in 1Q 2019 AR intends to execute a $600 MM share buyback program over the next 12 to 18 months Expected to be funded through proceeds from the midstream simplification transaction and free cash flow Funding is subject to estimated stand-alone net debt to stand-alone LTM EBITDAX leverage thresholds to protect balance sheet (2.25x in 2018 and 2.0x in 2019) . 2 Share Repurchase Program Funding Funding Sources $MM Expected minimum cash consideration in midstream simplification transaction $300 Portion of targeted free cash flow over the next 12 to 18 months $300 Total $600 Antero has completed its special committee process and is pleased to announce the following: 1 5
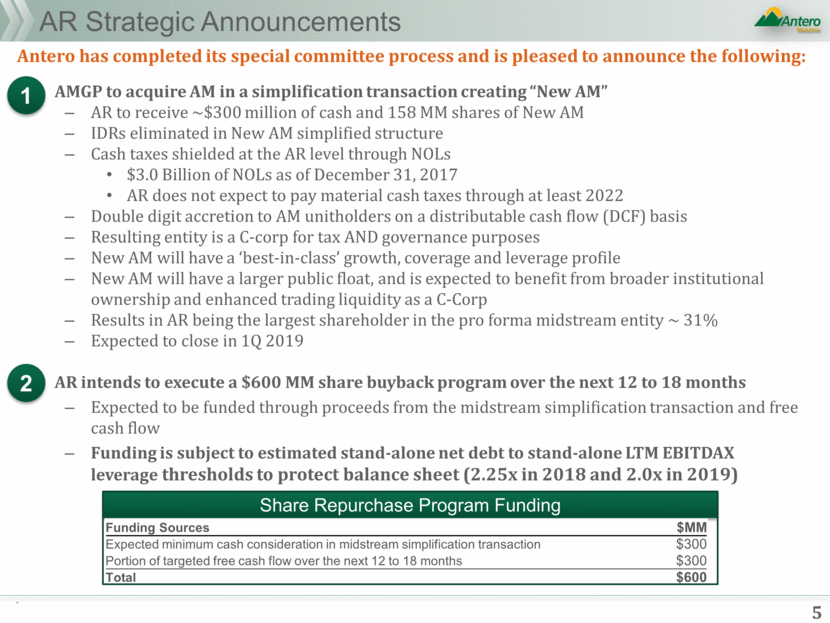
Midstream Simplification Transaction Overview AMGP to acquire 100% of outstanding common units of AM, including common units owned by AR Eliminates incentive distribution rights (“IDRs”) Results in aggregate consideration of $30.43 per AR-owned AM unit based on 10/8/18 AMGP closing price (1.776 AMGP shares if all equity consideration(1)) Includes a minimum of $3.00/unit in cash and 1.6023 shares of New AM to AR for each AM unit owned Cash to AR may increase (and shares decrease) depending on cash/stock election of public AM unitholder; cash pool totals $598 MM All-in consideration to AR represents a 3% premium to the October 8, 2018 close and 15% premium to the unaffected AM unit price prior to the formation of the Special Committees on February 23, 2018 Pro forma entity will convert to a C-corp for tax and governance purposes and will be renamed Antero Midstream Corporation (“New AM”) New AM will trade on the NYSE and will retain the “AM” ticker symbol Taxable to all AM common unitholders (AR to utilize NOL’s to shield taxable gain) New AM receives the benefit of a tax basis “step-up” (~$375 MM tax savings 2019 through 2022) PV-10 savings to New AM from tax basis “step-up” of approximately $800 million New AM dividend targets keep AR “whole” on existing distribution targets through previously communicated period from 2019 through 2022(1) while maintaining average DCF coverage of 1.2x to 1.3x(3) Transaction to be financed through borrowings on AM’s revolving credit facility Maintains trajectory towards investment grade rating profile Subject to majority of minority vote at AMGP and AM and expected to close in the 1Q of 2019 Financing Key Deal Terms Taxes Antero Midstream GP LP (“AMGP”) to acquire Antero Midstream Partners LP (“AM”) creating a premier Appalachian infrastructure organic growth corporation: “Antero Midstream Corporation” (NYSE: AM) or “New AM” Structure Voting & Close Dividends & DCF Coverage Represents exchange ratio assuming 100% equity election (based on 1.6023 equity exchange, plus $3.00 cash converted at 20-day AMGP VWAP). Assuming AM unitholders elect 100% equity consideration. Dividends subject to Board approval. 6
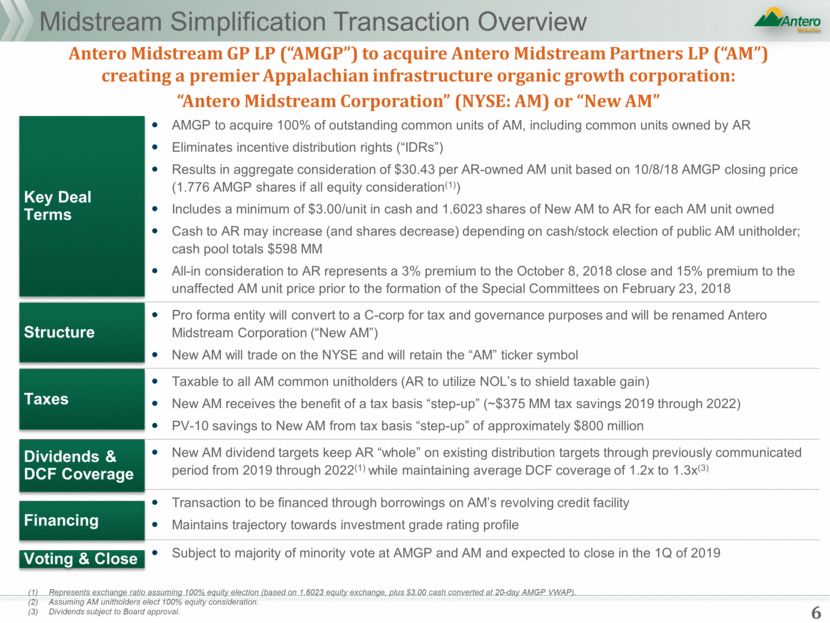
Status Quo Structure Antero Simplified Pro Forma Structure Simplified Pro Forma Structure 53% 100% Incentive Distribution Rights (IDRs) Sponsors/ Management Public Public 27% 73% Sponsors/ Management Public 59% 41% 47% 27% 73% 31% Midstream simplification transaction results in one publicly traded midstream entity and better aligns the interests of PE sponsors and management with AR shareholders Eliminates IDRs and the Series B profits interests related to the IDRs AR shareholders and PE sponsors / management will all own the same type of interest in the midstream entity (common stock) Public Public Sponsors/ Management Sponsors/ Management 25% 7 Series B Profits Interest (1) 44% 1) Series B profits interest held by Antero management. New AM 508 MM shares 188 MM units 186 MM shares
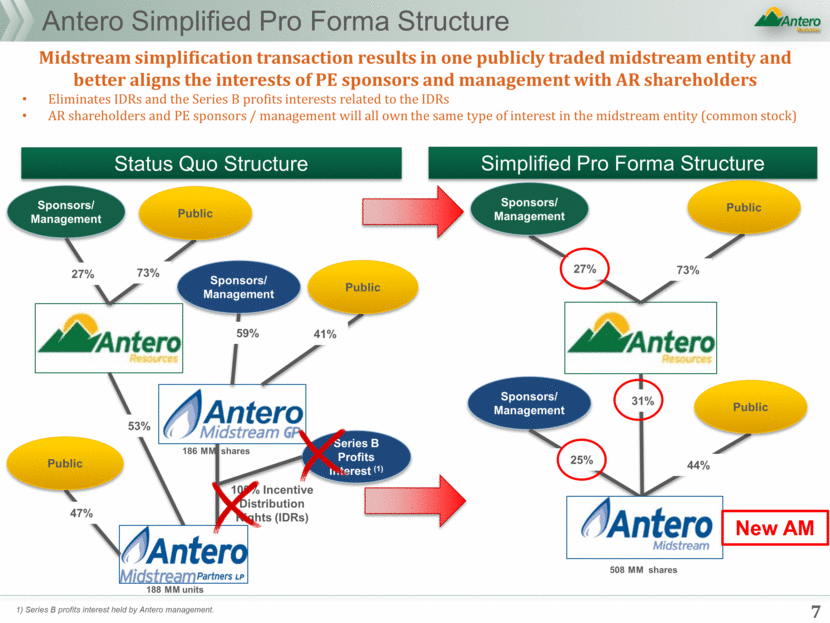
New AM – Same Cash Distribution Targets New AM Long-term Dividend, Leverage, and DCF Coverage Targets DCF Coverage Target of 1.2x – 1.3x +29% YoY From an AR perspective New AM will target the same dividends & year-over-year growth rates as legacy AM distributions with stronger DCF coverage (as a result of tax savings through 2022 and beyond) Note: For additional information regarding Non-GAAP Financial Measures and Definitions, please see the Appendix. 2019 distribution growth target relative to midpoint of 2018 guidance of $0.54/share and $1.72/unit for AMGP and AM, respectively. Represents exchange ratio for AR owned AM units assuming 100% equity election (1.776 AMGP shares, based on 1.6023 equity exchange, plus $3.00 cash converted at 20-day AMGP VWAP). +20% YoY +20% YoY DCF Coverage Target of 1.2x – 1.3x DCF Coverage Target of 1.1x – 1.2x Status Quo AM Targets – AR Perspective +29% YoY +20% YoY +20% YoY +29% YoY (1) +130% YoY(1) New AM Dividend: $1.24 x Exchange Ratio 1.776x(2) = AM Equivalent $2.21 x 1.776x x 1.776x x 1.776x x 1.776x 8 $2.21 $2.85 $3.42 $4.10 $2.21 $2.85 $3.42 $4.10 0.5x 1.0x 1.5x 2.0x 2.5x 3.0x 3.5x $0.00 $0.50 $1.00 $1.50 $2.00 $2.50 $3.00 $3.50 $4.00 $4.50 2019 Target 2020 Target 2021 Target 2022 Target Leverage and DCF CoverageRatio Distribution Per Unit AM Status Quo Distribution Target New AM Targets - 100% Equity Consideration Assumed Status Quo AM Debt / LTM Adj. EBITDA Targets $1.24 $1.60 $1.93 $2.31 0.5x 1.0x 1.5x 2.0x 2.5x 3.0x 3.5x $0.00 $0.50 $1.00 $1.50 $2.00 $2.50 2019 Target 2020 Target 2021 Target 2022 Target Leverage and DCF Coverage Ratio Dividend Per Share Dividend Per Share Target (midpoint) New AM Debt / LTM Adj. EBITDA Targets
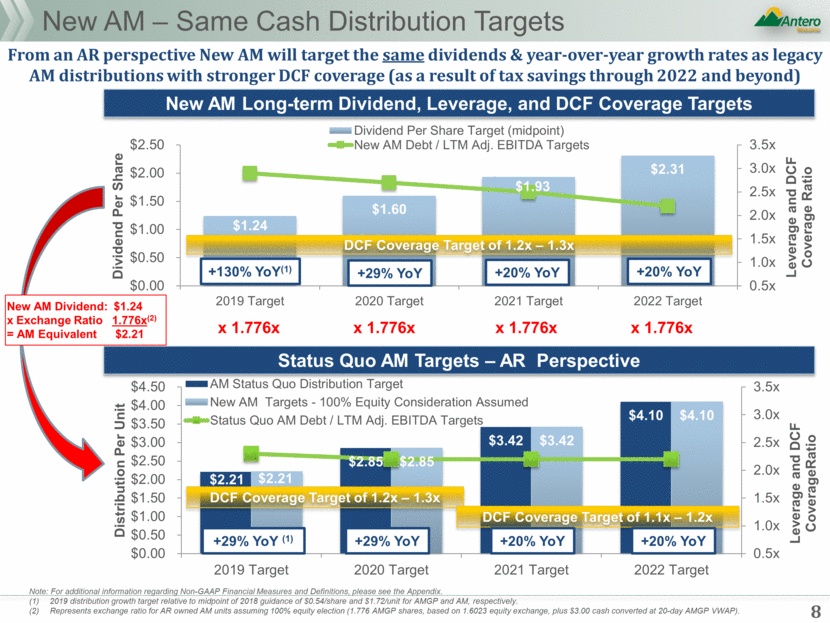
Share Repurchase Program Details Share repurchase program authorized over the next 12 to 18 months Open market and private transactions depending on market conditions Flexibility in program to optimize execution and capital allocation Expected to be funded through visible, accretive sources Initially funded with cash to be received from midstream simplification transaction (~$300 million) Portion of free cash flow generation from developing highly economic liquids-rich locations $125 MM from AM for first tranche of water earn-out payments Disciplined approach to share repurchases Maintain strong balance sheet with standalone net debt to LTM EBITDAX at or below 2.25x by YE 2018 and below 2.0x by YE 2019 The Board of AR has approved an initial $600MM share repurchase program, representing over 10% of AR’s shares outstanding assuming today’s share price 1 2 3 Note: Based on AR share price as of 10/8/2018 For additional information regarding Non-GAAP Measures please see the Appendix. 9
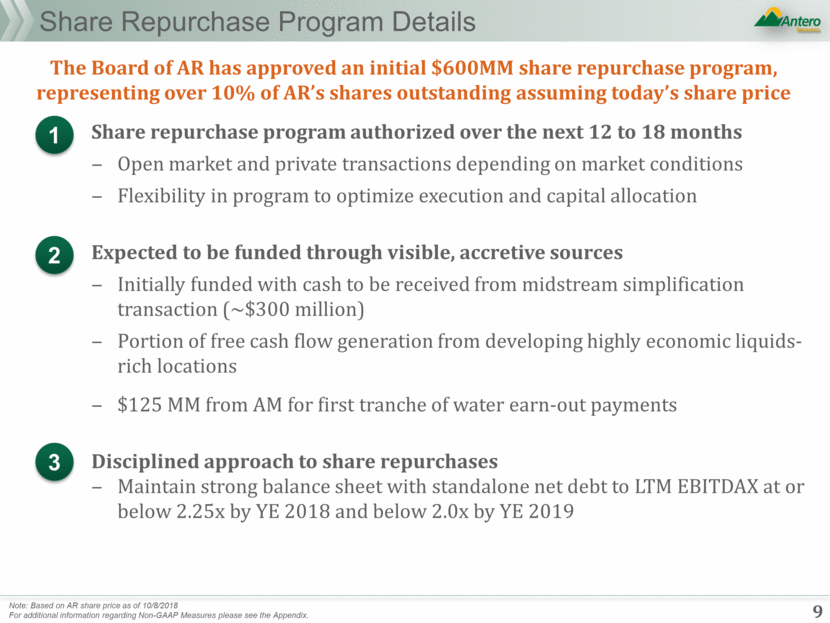
Share Repurchase Program Funding Share Repurchase Program Funding $600MM Disciplined Share Repurchase Program $300 MM Portion of Free Cash Flow Over Next 12 to 18 Months $300 MM AR cash consideration from midstream simplification transaction Aligns interest of management and shareholders in a tax efficient & accretive transaction Development plan focused on highly economic liquids-rich locations; Includes $125 million from Antero Midstream for first tranche of water earn-out payments Midstream Simplification Transaction ($300 million) Free Cash Flow Generation ($300 million) 1 2 Antero expects to fund its share repurchase program through the following sources: 10 Note: For additional information regarding Non-GAAP Measures please see the Appendix.
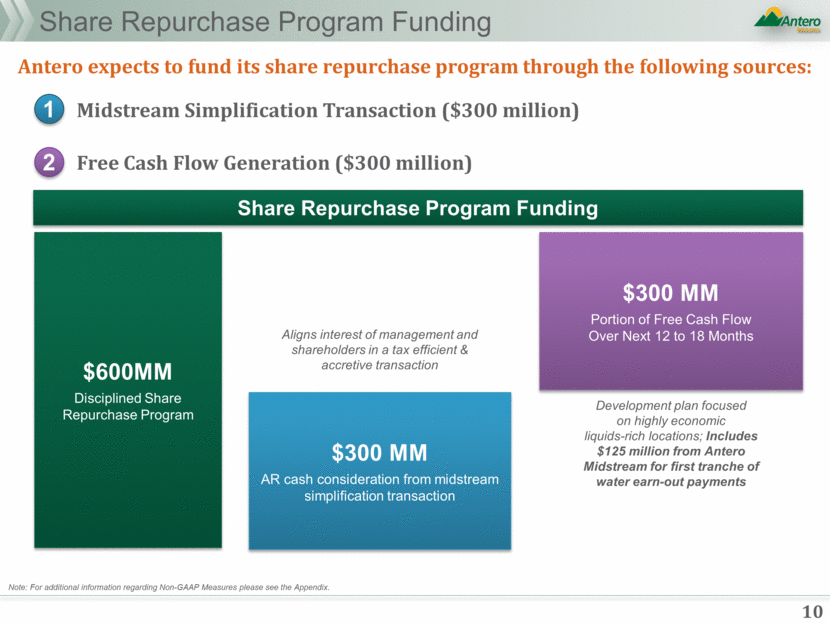
Compounding Leverage to Improving NGL Prices From 2015 - 2018 C3+ NGL prices have increased 94% while AR’s production has increased by 84% Production growth combined with pricing improvement drives compounding exposure to improving NGL prices Antero C3+ NGL Production vs Price ($/Bbl) (Bbl/d) ($/Bbl) (1) (2) Note: NGL pricing represents Mont Belvieu actuals assuming C3+ barrel weightings of: propane 57%, normal butane 16%, Isobutane 10%, pentanes 17%. 2018 production based on Antero guidance. Balance 2018 NGL pricing represents strip pricing as of 10/5/2018. 2019 production based on 20% production growth from 2018 guidance. +22% CAGR (2015 – 2019) +94% since 2015 11 195 5,815 19,458 42,055 55,408 69,882 77,500 93,000 - 10,000 20,000 30,000 40,000 50,000 60,000 70,000 80,000 90,000 100,000 2010A 2011A 2012A 2013A 2014A 2015A 2016A 2017A 2018E 2019E Antero C3+ Production (Left Axis) C3+ NGL Price (Right Axis) WTI Oil Price $0 $20 $40 $60 $80 $100 $120
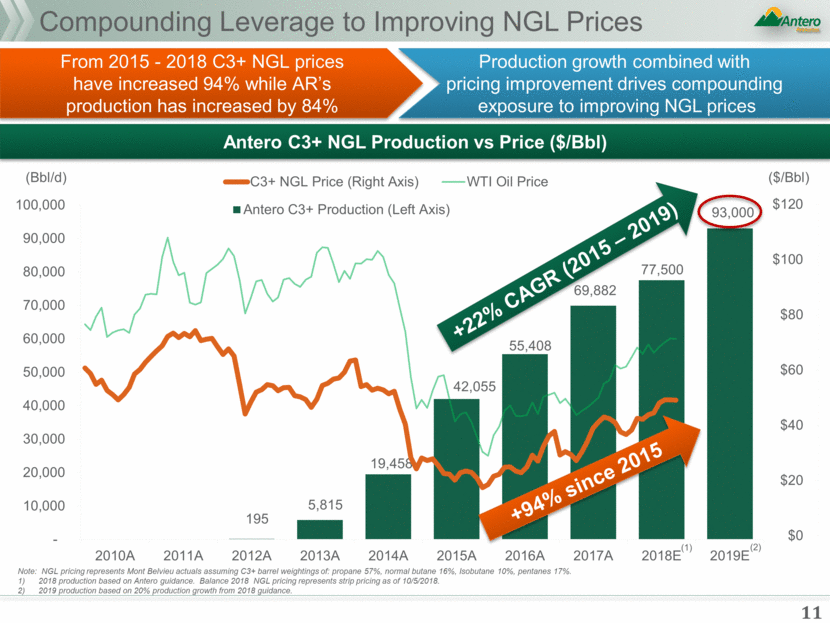
Leader in Leverage to NGL Prices Top NGL Producers in the U.S. (C3+ and ethane) Source: Bloomberg consensus, SEC filings and company press releases. Note: Volumes represent consensus as of 9/20/2018. 2Q 2018 realized prices are weighted average including ethane (C2) where applicable. Percent of 2Q 2018 total product revenues is calculated on a pre-hedge basis. 2Q 2018 actual NGL revenue percentage based on unhedged revenue. * Denotes consensus inclusive of international NGL production. NGLs Generate 33% of AR Revenue (1) 2Q 2018 $26.35 $27.86 $23.69 $24.10 $34.88 $26.71 $28.87 $25.62 $24.39 $28.83 Antero Delivers Highest Exposure to Rising NGL Prices Pre-hedged Realized NGL Price ($/Bbl) Pre-Hedge NGL % of Total Product Revenues * * * * 12 116 33% 10% 34% 15% 11% 11% 16% 11% 13% 13% 0% 5% 10% 15% 20% 25% 30% 35% 40% 45% 0 20 40 60 80 100 120 140 AR EOG RRC DVN APC COP OXY MRO NBL PXD NGL % of Pre - Hedge Product Revenues Consensus C2+ NGLs ( MBbl /d) 2018 Consensus C2+ NGL Production (1)
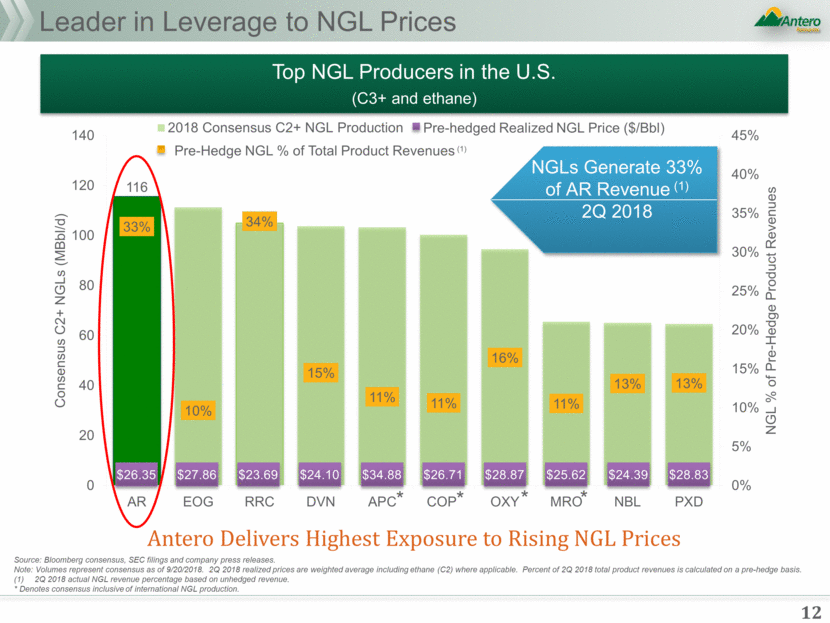
Pre-Hedge Revenue Sensitivity to C3+ NGL Pricing ($MM) Note: Represents 10/5/2018 strip Mont Belvieu pricing. 2H18 assumes Mariner East 2 in-service November 1 2018. 2H18 volumes implied by full year guidance and 1H18 actual results. 2019 volumes assume 20% liquids growth vs. 2018 C3+ guidance of 77,500 Bbl/d. Assumes C3+ barrel weightings of: propane 57%, normal butane 16%, Isobutane 10%, pentanes 17% and holds 1H18 local differential of $(6.00)/Bbl flat. Initial ME2 in-service 11/1/18 moving Antero’s fully contracted “Full ME2” 50,000 Bbl/d of contracted volumes. 67 MBbl/d No ME2 Powerful C3+ NGL Pricing Upside Exposure 93 MBbl/d Full ME2 93 MBbl/d Full ME2 88 MBbl/d ME2 on 11/1/18 Compounded pricing leverage from increasing volumes, prices, and Mariner East 2 uplift drives cash flow growth For every $5.00/Bbl increase in NGL prices, Antero generates an incremental $170MM in Revenue +$5/Bbl change = +$170MM in revenue +$270MM +$330 - $500MM 13 $700 $322 $491 $430 $1,130 $1,452 $1,621 $0 $200 $400 $600 $800 $1,000 $1,200 $1,400 $1,600 $1,800 1H 2018 Actual $35/Bbl 2H 2018E Strip Prices $43/Bbl 2018 Actual + Strip $40/Bbl 2019E Strip Prices $41/Bbl 2019E Strip +$5/Bbl $46/Bbl Incremental Revenue 77.5 MBbl /d ME2 on 11/1/18 Antero has no hedges in place for C3+ volumes for 2019 and beyond
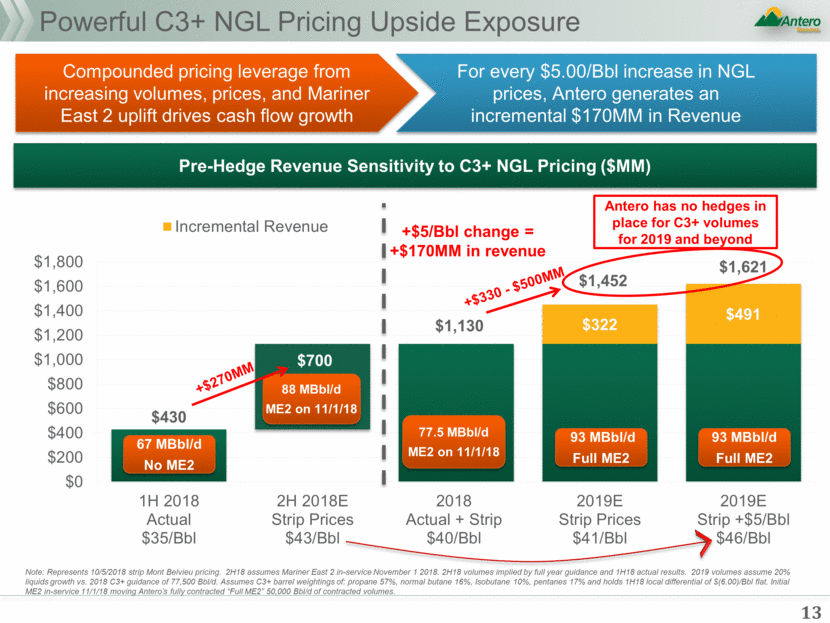
Antero’s Ethane Exposure: All Upside Antero’s ethane has a natural gas pricing “floor” and purity ethane “ceiling”; increases in ethane purity prices are all upside Antero’s balanced approach to ethane sales results in 50% of contracts tied to purity ethane prices vs. natural gas value Ethane Revenue Uplift ($MM) Ethane sensitivity: +$0.10/gallon x 2019 production target x ~50% exposure to Mt. Belvieu = ~$40MM incremental 2019 ethane Revenue 44 MBbl/d 55 MBbl/d 55 MBbl/d 35 MBbl/d Note: Ethane prices reflect realized price to Antero and assume $(0.05)/gallon discount to Mt. Belvieu prices based on 2018 Antero guidance. 2019 volumes are assumptions only, based on ME2 in-service and an increase in de-eth capacity expected to come on-line in 4Q18. +$0.10/Gal C2 price change = $40MM incremental revenue +$55MM +$90 - $130MM 14 $115 $90 $130 $60 $175 $265 $305 $0 $50 $100 $150 $200 $250 $300 $350 1H 2018 Actual $0.23/Gal 2H 2018E Strip Prices $0.45/Gal 2018 Actual + Strip $0.32/Gal 2019E Strip Prices $0.40/Gal 2019E +$0.10 Upside $0.50/Gal Incremental Revenue 40 MBbl /d Antero has no hedges in place for C2 volumes
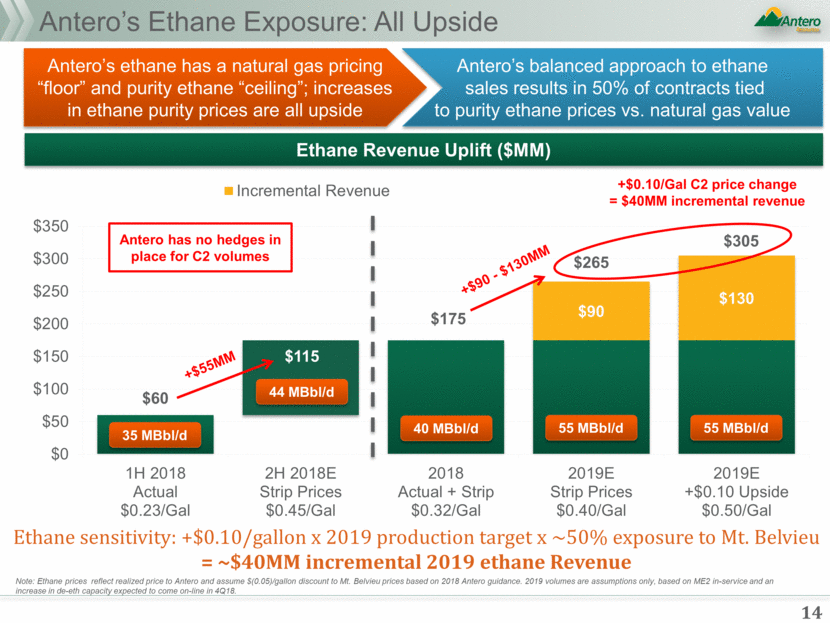
Antero’s Liquids Scale at Attractive Value Antero’s liquids scale and leverage to liquids prices compares favorably to Permian operators Attractive value proposition for similar liquids scale Liquids Production vs. Revenue Liquids Growth vs. EBITDAX Multiple Based on Factset consensus estimates (pre-hedge basis). Liquids include ethane, C3+ NGLs and oil. More Growth Cheaper Valuation More Scale More Leverage to Liquids Pricing 15 2.0x 3.0x 4.0x 5.0x 6.0x 7.0x 8.0x 9.0x 10.0x 0% 10% 20% 30% 40% 50% EV / 2019 Standalone E&P EBITDA Liquids Production Growth (2019 vs 2018) CDEV PE WPX XEC PXD FANG CXO QEP SM JAG AR $0 $1,000 $2,000 $3,000 $4,000 $5,000 $6,000 $7,000 0 100 200 300 400 2019 Liquids Revenues ($MM) 2019 Liquids Production ( MBbl /d) PXD CXO FANG WPX XEC PE CDEV JAG QEP SM AR
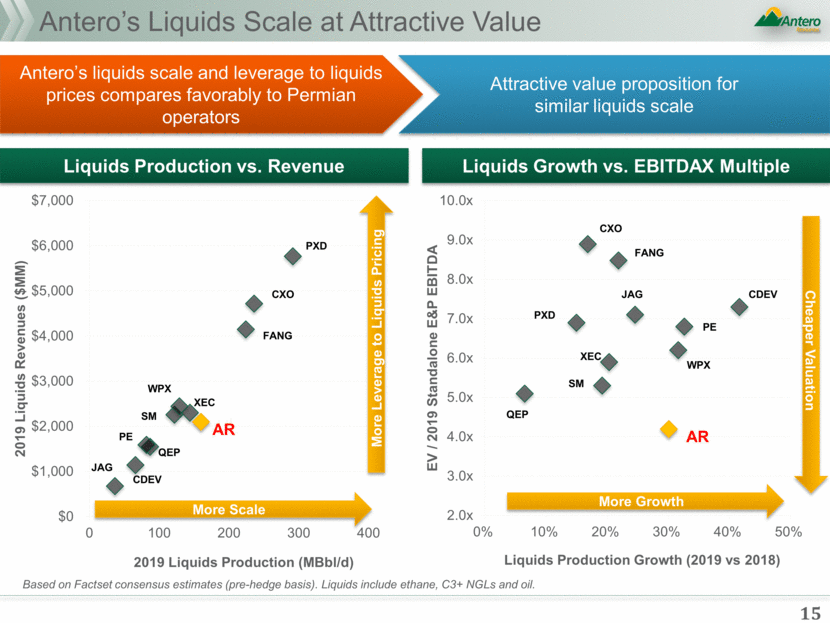
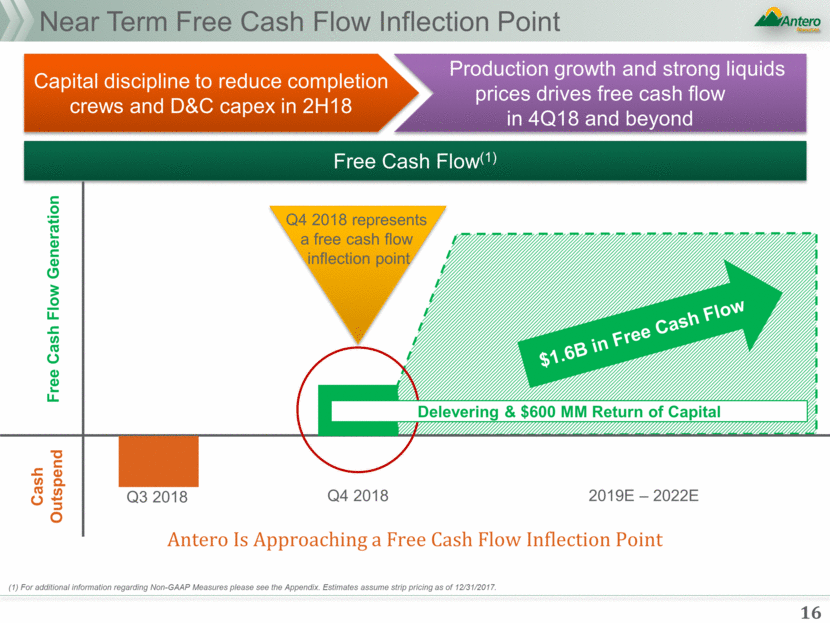
Near Term Free Cash Flow Inflection Point Free Cash Flow(1) Antero Is Approaching a Free Cash Flow Inflection Point (1) For additional information regarding Non-GAAP Measures please see the Appendix. Estimates assume strip pricing as of 12/31/2017. Capital discipline to reduce completion crews and D&C capex in 2H18 Production growth and strong liquids prices drives free cash flow in 4Q18 and beyond Cash Outspend Free Cash Flow Generation Q4 2018 represents a free cash flow inflection point 2019E – 2022E Q3 2018 Q4 2018 $1.6B in Free Cash Flow Delevering & $600 MM Return of Capital 16
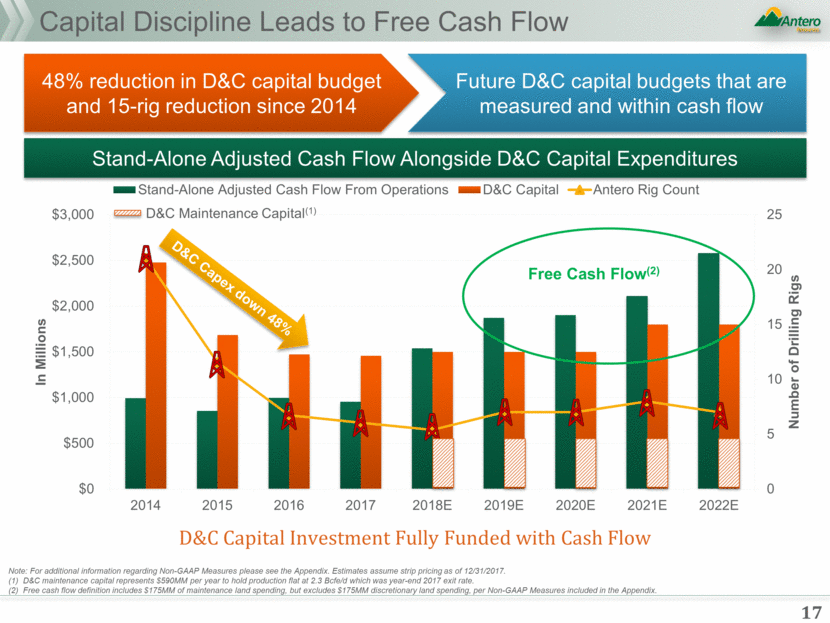
Capital Discipline Leads to Free Cash Flow Stand-Alone Adjusted Cash Flow Alongside D&C Capital Expenditures D&C Capital Investment Fully Funded with Cash Flow Note: For additional information regarding Non-GAAP Measures please see the Appendix. Estimates assume strip pricing as of 12/31/2017. (1) D&C maintenance capital represents $590MM per year to hold production flat at 2.3 Bcfe/d which was year-end 2017 exit rate. (2) Free cash flow definition includes $175MM of maintenance land spending, but excludes $175MM discretionary land spending, per Non-GAAP Measures included in the Appendix. 48% reduction in D&C capital budget and 15-rig reduction since 2014 Future D&C capital budgets that are measured and within cash flow Free Cash Flow(2) D&C Capex down 48% D&C Maintenance Capital(1) 17 0 5 10 15 20 25 $0 $500 $1,000 $1,500 $2,000 $2,500 $3,000 2014 2015 2016 2017 2018E 2019E 2020E 2021E 2022E Number of Drilling Rigs In Millions Stand-Alone Adjusted Cash Flow From Operations D&C Capital Antero Rig Count
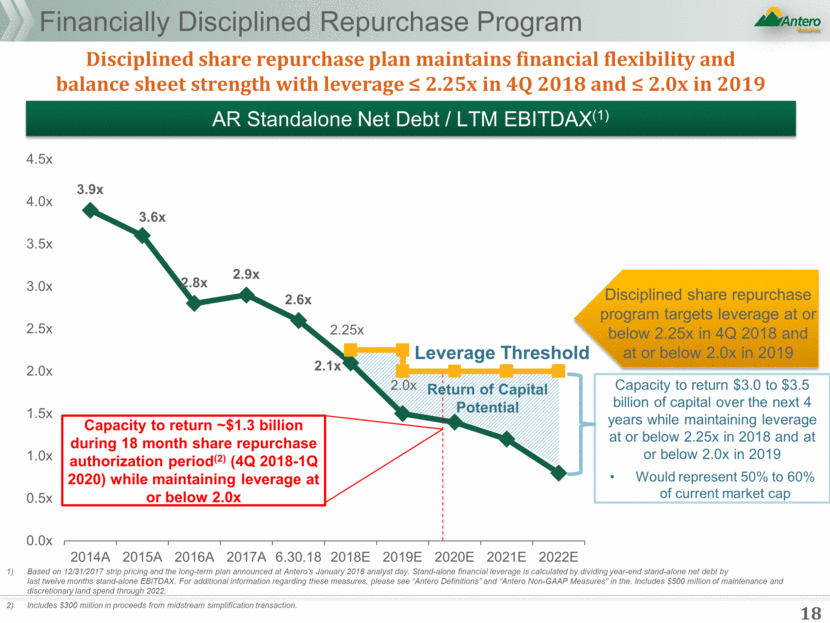
Financially Disciplined Repurchase Program Disciplined share repurchase plan maintains financial flexibility and balance sheet strength with leverage 2.25x in 4Q 2018 and 2.0x in 2019 Disciplined share repurchase program targets leverage at or below 2.25x in 4Q 2018 and at or below 2.0x in 2019 Capacity to return $3.0 to $3.5 billion of capital over the next 4 years while maintaining leverage at or below 2.25x in 2018 and at or below 2.0x in 2019 Would represent 50% to 60% of current market cap AR Standalone Net Debt / LTM EBITDAX(1) Based on 12/31/2017 strip pricing and the long-term plan announced at Antero’s January 2018 analyst day. Stand-alone financial leverage is calculated by dividing year-end stand-alone net debt by last twelve months stand-alone EBITDAX. For additional information regarding these measures, please see “Antero Definitions” and “Antero Non-GAAP Measures” in the. Includes $500 million of maintenance and discretionary land spend through 2022. Includes $300 million in proceeds from midstream simplification transaction. Leverage Threshold Return of Capital Potential 18 Capacity to return ~$1.3 billion during 18 month share repurchase authorization period(2) (4Q 2018-1Q 2020) while maintaining leverage at or below 2.0x 3.9x 3.6x 2.8x 2.9x 2.6x 2.1x 2.25x 2.0x 0.0x 0.5x 1.0x 1.5x 2.0x 2.5x 3.0x 3.5x 4.0x 4.5x 2014A 2015A 2016A 2017A 6.30.18 2018E 2019E 2020E 2021E 2022E
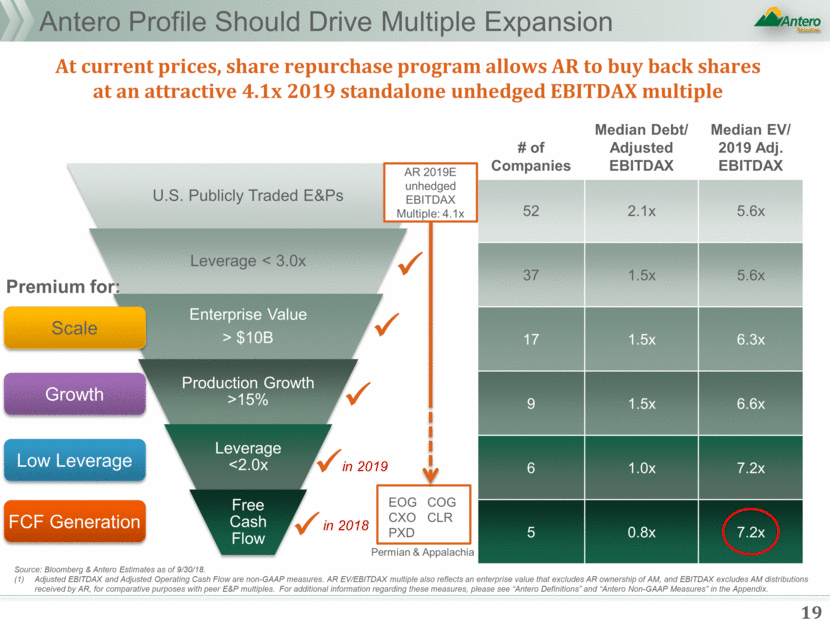
Antero Profile Should Drive Multiple Expansion Source: Bloomberg & Antero Estimates as of 9/30/18. Adjusted EBITDAX and Adjusted Operating Cash Flow are non-GAAP measures. AR EV/EBITDAX multiple also reflects an enterprise value that excludes AR ownership of AM, and EBITDAX excludes AM distributions received by AR, for comparative purposes with peer E&P multiples. For additional information regarding these measures, please see “Antero Definitions” and “Antero Non-GAAP Measures” in the Appendix. # of Companies Median Debt/ Adjusted EBITDAX Median EV/ 2019 Adj. EBITDAX 52 2.1x 5.6x 37 1.5x 5.6x 17 1.5x 6.3x 9 1.5x 6.6x 6 1.0x 7.2x 5 0.8x 7.2x EOG CXO PXD AR 2019E unhedged EBITDAX Multiple: 4.1x Scale Growth Low Leverage Permian & Appalachia FCF Generation COG CLR in 2019 in 2018 Premium for: At current prices, share repurchase program allows AR to buy back shares at an attractive 4.1x 2019 standalone unhedged EBITDAX multiple 19 U.S. Publicly Traded E&Ps Leverage < 3.0x Enterprise Value > $10B Production Growth >15% Leverage <2.0x Free Cash Flow
Summary Simplification Transaction Benefits AR will remain the largest shareholder of Antero Midstream with a ~31% pro forma ownership Maintains Antero’s integrated strategy and long-term outlook Continued visibility into infrastructure buildout and full midstream value chain participation Unique midstream vehicle with scale, low leverage and peer-leading distribution growth Creates tax efficient, traditional C-corp governance structure for New AM Broadens investor base and improves stock liquidity Tax basis step-up creates long-term tax shield at New AM AR able to effectively monetize portion of NOL position to offset gain on AM units Results in a stepped up tax basis for AR in New AM shares Eliminates IDRs Aligns shareholder interests and eliminates “hyper growth” midstream vehicle in which AR had no direct ownership 1 2 3 4 AR receives cash and a premium for its AM ownership Receives a minimum of $300 million of cash which serves as a catalyst to fund a portion of AR’s share repurchase program “Selling” midstream units to AMGP at a premium to market price Midstream simplification transaction attributes: Facilitates development of leading Integrated NGL platform in “core of the core” Marcellus and Utica Lowers cost of capital and increases access to capital for New AM 5 20
Appendix
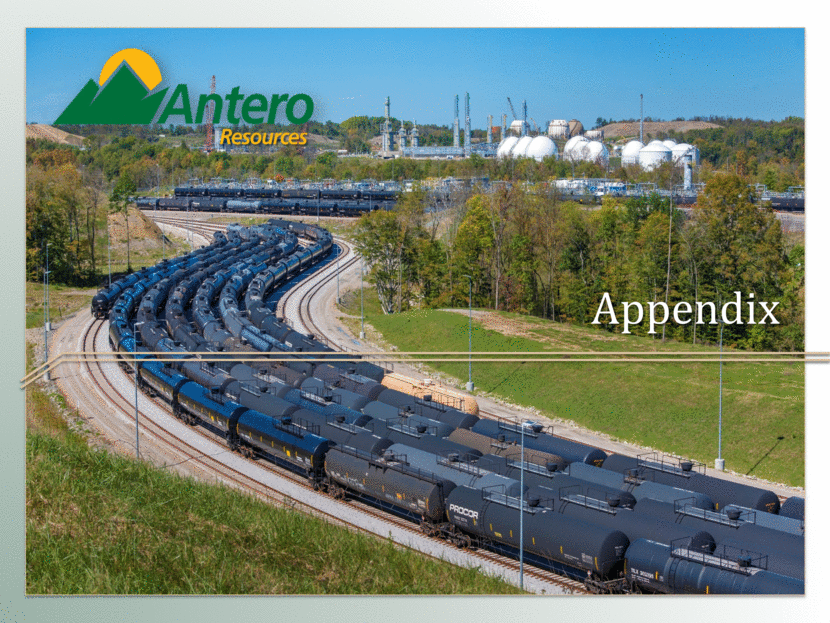
Best in Class Midstream Vehicle Simplification “checks all the boxes” for midstream investors Attribute 1099 Tax Form No IDRs Self-funding Model Reasonable Leverage Visible Growth Capital Efficiency Strong DCF Coverage Sufficient Liquidity Elected Board Tax Shield C-corp for tax and governance purposes with 1099 tax form One publicly traded midstream security with no IDRs No expected equity needs to fund $2.7 billion organic project backlog Leverage near 3.0x expected to decline into the low 2-times Organically driven distribution CAGR of 27% from 2018 through 2021 C-corp with Board governed by a majority of independent directors Substantially shielded from anticipated taxes through at least 2024 Just-in-time non speculative capital investment with 15-20% ROIC Antero Midstream Corporation 22 1.2x – 1.3x DCF coverage with long-term visibility ~$4.0 billion public float, or 44% of the shares outstanding
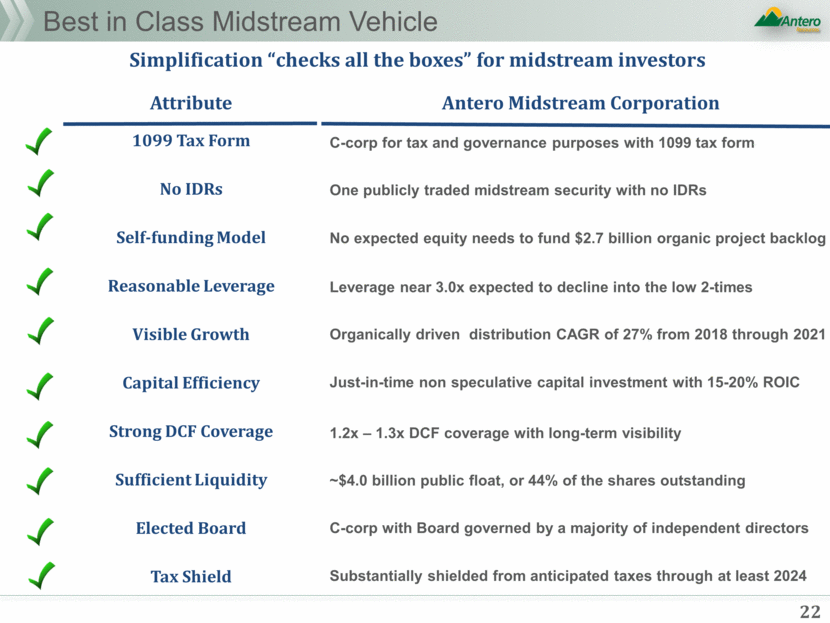
Series B Profits Elimination Prior to Simplification: The Series B profits interests were created in December 2016 through an agreement between Antero’s co-founders and private equity sponsors, who jointly owned 100% of IDR LLC prior to the AMGP IPO Series B units are entitled to receive up to 6% of the IDR distributions from AM in excess of $7.5 million on a quarterly basis Series B holders have the option to exchange into AMGP common shares at any time after vesting up until December 31, 2026 based on 6% of AMGP’s equity market capitalization at the time of the exchange less $2 billion (mandatory exchange on 12/31/26) AMGP does not have the right to force exchange until 12/31/26 Units vest ratably over a three year period beginning on December 31, 2016 After Simplification: In order to facilitate the simplification transaction Series B Holders have agreed to an early termination of the Series B profits interest at closing Under existing terms of Series B units, would be exchangeable at holders option following closing and until 12/31/26 up to 6.0% of the pro forma market cap of New AM in excess of $2.0 billion Instead, agreed to exchange into a fixed 17.354 MM shares of New AM at closing of simplification, which represents approximately 4.4% of the pro forma market cap of New AM in excess of $2.0 billion Gave up 8 years of option value on future AM and AMGP equity issuances and market capitalization increases Vesting Schedule remains in place and Series B unitholders will not receive New AM dividends on the unvested shares in 2019 23
24 Antero Non-GAAP Measures Consolidated Adjusted EBITDAX, Stand-Alone Adjusted EBITDAX, Consolidated Adjusted Operating Cash Flow, Stand-Alone Adjusted Operating Cash Flow and Free Cash Flow are financial measures that are not calculated in accordance with U.S. generally accepted accounting principles (“GAAP”). The non-GAAP financial measures used by the company may not be comparable to similarly titled measures utilized by other companies. These measures should not be considered in isolation or as substitutes for their nearest GAAP measures. The Stand-alone measures are presented to isolate the results of the operations of Antero apart from the performance of Antero Midstream, which is otherwise consolidated into the results of Antero. Consolidated Adjusted EBITDAX and Stand-Alone Adjusted EBITDAX The GAAP financial measure nearest to Consolidated Adjusted EBITDAX is net income or loss including non-controlling interest that will be reported in Antero’s consolidated financial statements. The GAAP financial measure nearest to Stand-Alone Adjusted EBITDAX is Stand-alone net income or loss that will be reported in the Parent column of Antero’s guarantor footnote to its financial statements. While there are limitations associated with the use of Consolidated Adjusted EBITDAX and Stand-Alone Adjusted EBITDAX described below, management believes that these measures are useful to an investor in evaluating the company’s financial performance because these measures: • are widely used by investors in the oil and gas industry to measure a company’s operating performance without regard to items excluded from the calculation of such term, which can vary substantially from company to company depending upon accounting methods and book value of assets, capital structure and the method by which assets were acquired, among other factors; • helps investors to more meaningfully evaluate and compare the results of Antero’s operations (both on a consolidated and Stand-alone basis) from period to period by removing the effect of its capital structure from its operating structure; and • is used by management for various purposes, including as a measure of Antero’s operating performance (both on a consolidated and Stand-alone basis), in presentations to the company’s board of directors, and as a basis for strategic planning and forecasting. Consolidated Adjusted EBITDAX is also used by the board of directors as a performance measure in determining executive compensation. Consolidated Adjusted EBITDAX, as defined by our credit facility, is used by our lenders pursuant to covenants under our revolving credit facility and the indentures governing the company’s senior notes. There are significant limitations to using Consolidated Adjusted EBITDAX and Stand-Alone Adjusted EBITDAX as measures of performance, including the inability to analyze the effect of certain recurring and non-recurring items that materially affect the company’s net income on a consolidated and Stand-alone basis, the lack of comparability of results of operations of different companies and the different methods of calculating Adjusted EBITDAX reported by different companies. In addition, Consolidated Adjusted EBITDAX and Stand-Alone Adjusted EBITDAX provide no information regarding a company’s capital structure, borrowings, interest costs, capital expenditures, and working capital movement or tax position.
25 Antero Non-GAAP Measures Consolidated Adjusted Operating Cash Flow, Stand-Alone Adjusted Operating Cash Flow and Free Cash Flow The GAAP financial measure nearest to Consolidated Adjusted Operating Cash Flow is cash flow from operating activities as reported in Antero’s consolidated financial statements. The GAAP financial measure nearest to Stand-Alone Adjusted Operating Cash Flow and Free Cash Flow is Stand-alone cash flow from operating activities that will be reported in the Parent column of Antero’s guarantor footnote to its financial statements. Management believes that Consolidated Adjusted Operating Cash Flow and Stand-Alone Adjusted Operating Cash Flow are useful indicators of the company’s ability to internally fund its activities and to service or incur additional debt on a consolidated and Stand-alone basis. Management believes that changes in current assets and liabilities, which are excluded from the calculation of these measures, relate to the timing of cash receipts and disbursements and therefore may not relate to the period in which the operating activities occurred and generally do not have a material impact on the ability of the company to fund its operations. Management believes that Free Cash Flow is a useful measure for assessing the company’s financial performance and measuring its ability to generate excess cash from its operations. There are significant limitations to using Consolidated Adjusted Operating Cash Flow, Stand-Alone Adjusted Operating Cash Flow and Free Cash Flow as measures of performance, including the inability to analyze the effect of certain recurring and non-recurring items that materially affect the company’s net income on a consolidated and Stand-Alone basis, the lack of comparability of results of operations of different companies and the different methods of calculating Consolidated Adjusted Operating Cash Flow and Stand-alone Adjusted Operating Cash Flow reported by different companies. Consolidated Adjusted Operating Cash Flow and Stand-Alone Adjusted Operating Cash Flow do not represent funds available for discretionary use because those funds may be required for debt service, capital expenditures, working capital, income taxes, franchise taxes, exploration expenses, and other commitments and obligations. Antero has not included reconciliations of Consolidated Adjusted Operating Cash Flow, Stand-Alone Adjusted Operating Cash Flow and Free Cash Flow to their nearest GAAP financial measures for 2018 because it would be impractical to forecast changes in current assets and liabilities. However, Antero is able to forecast the earn out payments expected from Antero Midstream associated with the water drop down transaction that occurred in 2015, each of which is a reconciling item between Stand-Alone Adjusted Operating Cash Flow and Free Cash Flow, as applicable, and cash flow from operating activities as reported in the Parent column of Antero’s guarantor footnote to its financial statements. Antero forecasts these items to be $125 million in each of 2019 and 2020. Additionally, Antero is able to forecast lease maintenance expenditures and Stand-alone drilling and completion capital, each of which is a reconciling item between Free Cash Flow and its most comparable GAAP financial measure. For the 2018 to 2022 period, Antero forecasts cumulative lease maintenance expenditures of $200 million and cumulative Stand-Alone drilling and completion capital of $8.6 billion.
26 Appendix II disclosures & reconciliations Antero Definitions Consolidated Adjusted EBITDAX: Represents net income or loss from continuing operations, including noncontrolling interests, before interest expense, interest income, derivative fair value gains or losses (excluding net cash receipts or payments on derivative instruments included in derivative fair value gains or losses), taxes, impairment, depletion, depreciation, amortization, and accretion, exploration expense, franchise taxes, equity-based compensation, gain or loss on early extinguishment of debt, and gain or loss on sale of assets. Consolidated Adjusted EBITDAX also includes distributions from unconsolidated affiliates and excludes equity in earnings or losses of unconsolidated affiliates. See “Non-GAAP Measures” for additional detail. Consolidated Adjusted Operating Cash Flow: Represents net cash provided by operating activities before changes in current assets and liabilities. See “Non-GAAP Measures” for additional detail. Consolidated Drilling & Completion Capital: Represents drilling and completion capital as reported in AR’s consolidated cash flow statements (i.e., fees paid to AM for water handling and treatment are eliminated upon consolidation and only operating costs associated with water handling and treatment are capitalized). Debt-Adjusted Shares: Represents ending period debt divided by ending share price plus ending shares outstanding. Forecasted debt-adjusted shares assumes AR share price of $19.87 per share as of January 12, 2018. F&D Cost: Represents current D&C cost per 1,000’ lateral divided by net EUR per 1,000’ lateral assuming 85% NRI in Marcellus and 81% NRI in Utica. There is no directly comparable financial measure presented in accordance with GAAP for F&D Cost and therefore, a reconciliation to GAAP is not practicable. Free Cash Flow: Represents Stand-alone E&P Adjusted operating cash flow, less Stand-alone E&P Drilling and Completion capital, less Land Maintenance capital. See “Non-GAAP Measures” for additional detail. Land Maintenance Capital: Represents leasehold capital expenditures required to achieve targeted working interest percentage of 95% for 5-year development plan (i.e. historical average working interest), plus renewals associated with 5-year development plan. Leverage Ratio: Represents ending period net debt (debt adjusted for cash and cash equivalents) divided by LTM Adjusted EBITDAX. Leverage ratios for future years reflect projected net debt divided by period Adjusted EBITDAX. Maintenance Capital: Represents stand-alone E&P Drilling & Completion Capital expenditures that are estimated to be necessary to sustain production at current (2017) production levels (2.3 Bcfe/d). Stand-Alone E&P Adjusted EBITDAX: Represents income or loss from continuing operations as reported in the Parent column of AR’s guarantor footnote to its financial statements before interest expense, interest income, derivative fair value gains or losses from exploration and production and marketing (excluding net cash receipts or payments on derivative instruments included in derivative fair value gains or losses), impairment, depletion, depreciation, amortization, and accretion, exploration expense, franchise taxes, equity-based compensation, gain or loss on early extinguishment of debt, gain or loss on sale of assets, and gain or loss on changes in the fair value of contingent acquisition consideration. Stand-alone E&P Adjusted EBITDAX also includes distributions received from limited partner interests in Antero Midstream common units. See “Non-GAAP Measures” for additional detail. Stand-Alone E&P Adjusted Operating Cash Flow: Represents net cash provided by operating activities as reported in the Parent column of AR’s guarantor footnote to its financial statements before changes in current assets and liabilities, plus the AM cash distributions payable to AR, plus the earn out payments expected from Antero Midstream associated with the water drop down transaction that occurred in 2015. See “Non-GAAP Measures” on slide 18 for additional detail. Stand-Alone Drilling & Completion Capital: Represents drilling and completion capital as reported in the Parent column of AR’s guarantor footnote to its financial statements and includes 100% of fees paid to AM for water handling and treatment and excludes operating costs associated with AM’s Water Handling and Treatment segment).
Antero Midstream Non-GAAP Measures 27 Non-GAAP Financial Measures and Definitions Antero Midstream views Adjusted EBITDA as an important indicator of the Partnership’s performance. Antero Midstream defines Adjusted EBITDA as Net Income before interest expense, depreciation expense, impairment expense, accretion of contingent acquisition consideration, equity-based compensation expense, excluding equity in earnings of unconsolidated affiliates and including cash distributions from unconsolidated affiliates. Antero Midstream uses Adjusted EBITDA to assess: the financial performance of the Partnership’s assets, without regard to financing methods in the case of Adjusted EBITDA, capital structure or historical cost basis; its operating performance and return on capital as compared to other publicly traded partnerships in the midstream energy sector, without regard to financing or capital structure; and the viability of acquisitions and other capital expenditure projects. The Partnership defines Distributable Cash Flow as Adjusted EBITDA less interest paid, income tax withholding payments and cash reserved for payments of income tax withholding upon vesting of equity-based compensation awards, cash reserved for bond interest and ongoing maintenance capital expenditures paid. Antero Midstream uses Distributable Cash Flow as a performance metric to compare the cash generating performance of the Partnership from period to period and to compare the cash generating performance for specific periods to the cash distributions (if any) that are expected to be paid to unitholders. Distributable Cash Flow does not reflect changes in working capital balances. The Partnership defines Return on Invested Capital as net income plus interest expense divided by average total liabilities and partners’ capital, excluding current liabilities. Management believes that Return on Invested Capital is a useful indicator of the Partnership’s return on its infrastructure investments. The Partnership defines consolidated net debt as consolidated total debt less cash and cash equivalents. Antero Midstream views consolidated net debt as an important indicator in evaluating the Partnership’s financial leverage. The Partnership defines leverage as net debt divided by Adjusted EBITDA.
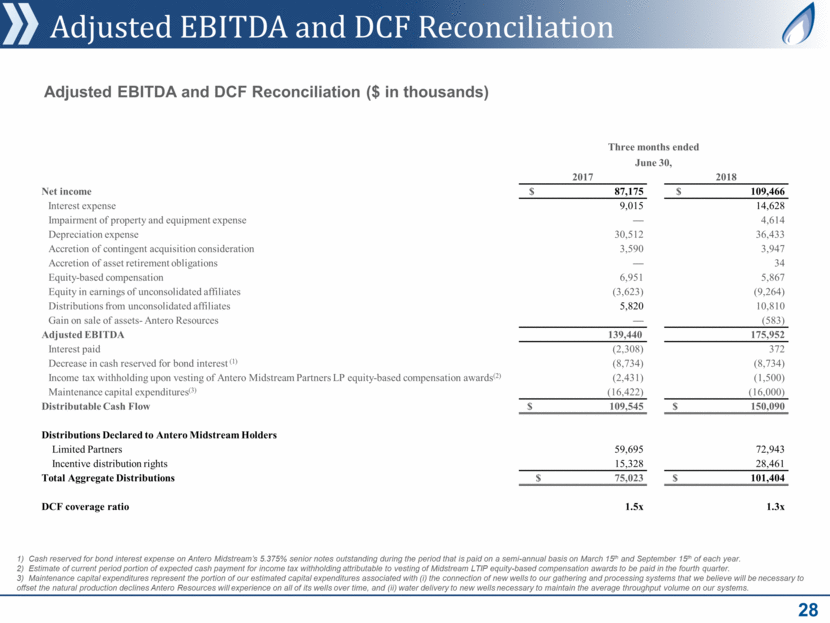
Adjusted EBITDA and DCF Reconciliation 28 Adjusted EBITDA and DCF Reconciliation ($ in thousands) Three months ended June 30, 2017 2018 Net income $ 87,175 $ 109,466 Interest expense 9,015 14,628 Impairment of property and equipment expense — 4,614 Depreciation expense 30,512 36,433 Accretion of contingent acquisition consideration 3,590 3,947 Accretion of asset retirement obligations — 34 Equity-based compensation 6,951 5,867 Equity in earnings of unconsolidated affiliates (3,623) (9,264) Distributions from unconsolidated affiliates 5,820 10,810 Gain on sale of assets- Antero Resources — (583) Adjusted EBITDA 139,440 175,952 Interest paid (2,308) 372 Decrease in cash reserved for bond interest (1) (8,734) (8,734) Income tax withholding upon vesting of Antero Midstream Partners LP equity-based compensation awards(2) (2,431) (1,500) Maintenance capital expenditures(3) (16,422) (16,000) Distributable Cash Flow $ 109,545 $ 150,090 Distributions Declared to Antero Midstream Holders Limited Partners 59,695 72,943 Incentive distribution rights 15,328 28,461 Total Aggregate Distributions $ 75,023 $ 101,404 DCF coverage ratio 1.5x 1.3x 1) Cash reserved for bond interest expense on Antero Midstream’s 5.375% senior notes outstanding during the period that is paid on a semi-annual basis on March 15th and September 15th of each year. 2) Estimate of current period portion of expected cash payment for income tax withholding attributable to vesting of Midstream LTIP equity-based compensation awards to be paid in the fourth quarter. 3) Maintenance capital expenditures represent the portion of our estimated capital expenditures associated with (i) the connection of new wells to our gathering and processing systems that we believe will be necessary to offset the natural production declines Antero Resources will experience on all of its wells over time, and (ii) water delivery to new wells necessary to maintain the average throughput volume on our systems.
Antero Midstream Non-GAAP Measures 29 Twelve Months Ended June 30, 2018 Net income $ 362,620 Interest expense 45,631 Impairment of property and equipment expense 28,045 Depreciation expense 130,379 Accretion of contingent acquisition consideration 14,180 Accretion of asset retirement obligations 68 Equity-based compensation 26,124 Equity in earnings of unconsolidated affiliate (31,467) Distributions from unconsolidated affiliates 32,270 Gain on sale of asset – Antero Resources (583) Adjusted EBITDA $ 607,267 The following table reconciles net income to Adjusted EBITDA for the twelve months ended June 30, 2018 as used in this presentation (in thousands): June 30, 2018 Bank credit facility $ 770,000 5.375% AM senior notes due 2024 650,000 Consolidated total debt $ 1,420,000 Cash and cash equivalents (19,525) Consolidated net debt $ 1,400,475 The following table reconciles consolidated total debt to consolidated net debt (“Net Debt”) as used in this presentation (in thousands):
